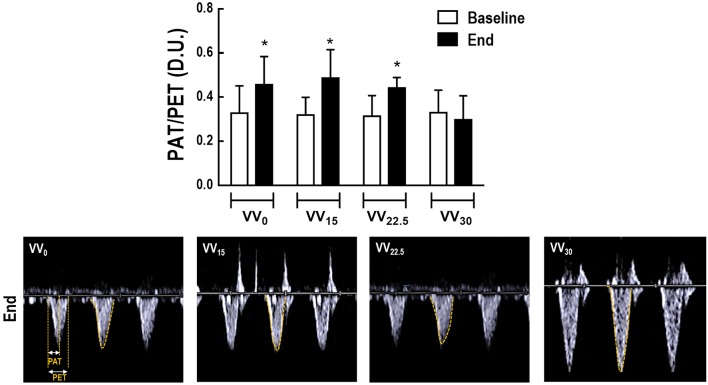
Figure 2.
Cardiovascular function was assessed by echocardiography. Upper panel: PAT, pulmonary acceleration time; PET, pulmonary ejection time. Data presented as mean and standard deviation of 7 animals in all groups. The PAT/PET ratio was used as an indirect index of pulmonary arterial hypertension. (*) Significantly different from BASELINE (p < 0.05). Lower panel: representative images of pulmonary blood flow.

