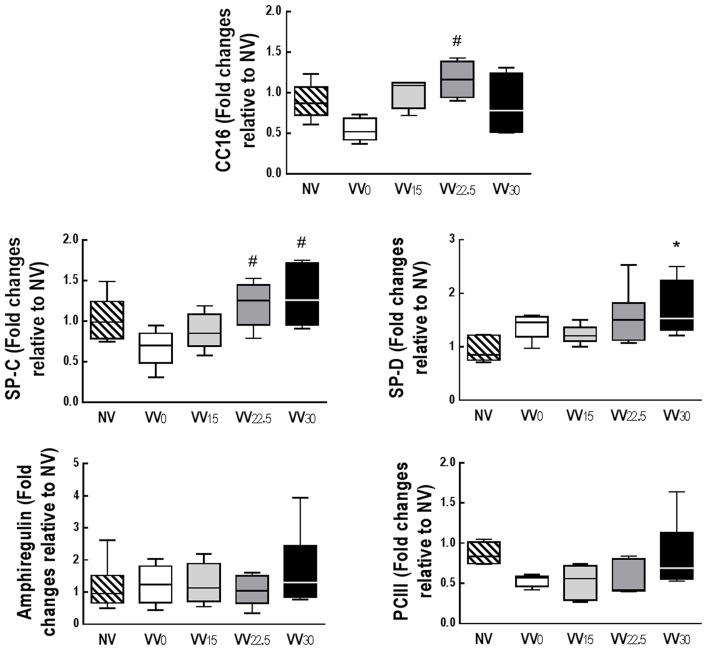
Figure 4.
Quantitative real-time polymerase chain reaction analysis of biological markers of club cell protein (CC)-16, alveolar epithelial cells [surfactant proteins (SP)-C, SP-D], mechanical cell stress (amphiregulin), and fibrogenesis [type III procollagen (PCIII)]. Data are presented as a box plot. Lines denote the median and boxes delimit the 25th and 75th percentiles of 7 animals per group. Relative gene expression was calculated as a ratio of the average gene expression levels compared with the reference gene (36B4) and expressed as fold change relative to NV. *Significantly different from NV group (p < 0.05); #Significantly different from VV0 group (p < 0.05).

