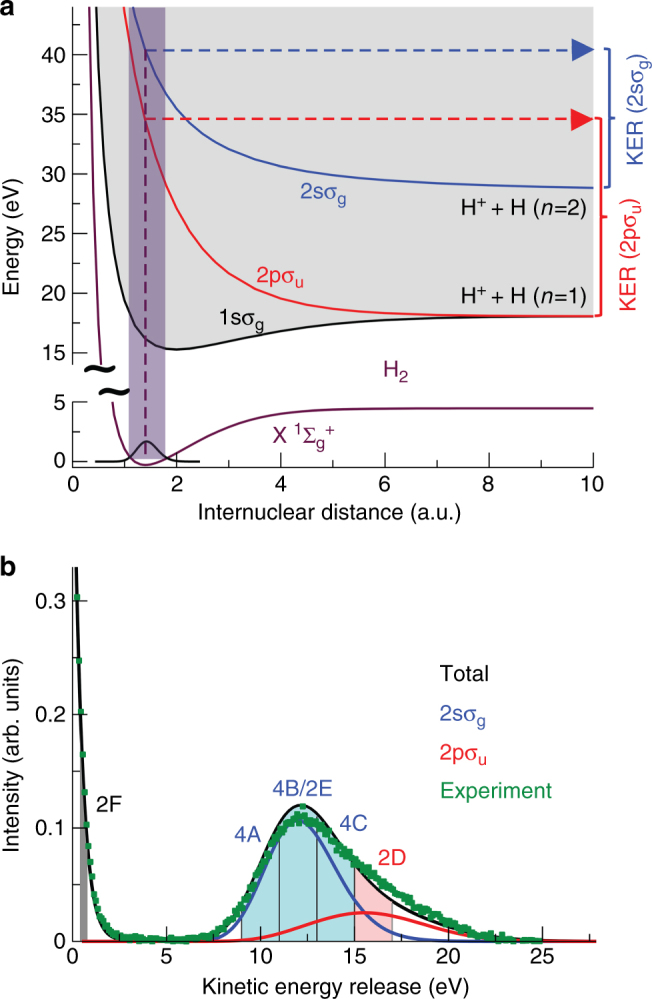
Fig. 3.

Correlation diagram and kinetic energy distribution for dissociation of a Potential energy curves for the ground state of H2 (lower curve) and the , , and ionization thresholds (upper curves). The latter correspond to electronic states of . The violet shaded area represents the Franck-Condon region associated to the ground vibrational state of H2. Notice the break in the energy scale for a better visualization. The dashed violet line shows how the initial internuclear distance of the molecule is mapped onto the kinetic energy release (KER) of the reaction applying the”reflection approximation”9. b KER distribution obtained after single-photon ionization of H2 employing photons of hν = 400 eV. Symbols: experiment, lines: theory. The calculation depicted by the black curve includes the twelve states with the highest photo ionization cross sections (up to n = 4). The main contributions (besides at low KER) are shown in blue () and red (), others are not visible on that scale. The shaded areas indicate the regions of KER selected in Figs. 2d–f and 4a, c
