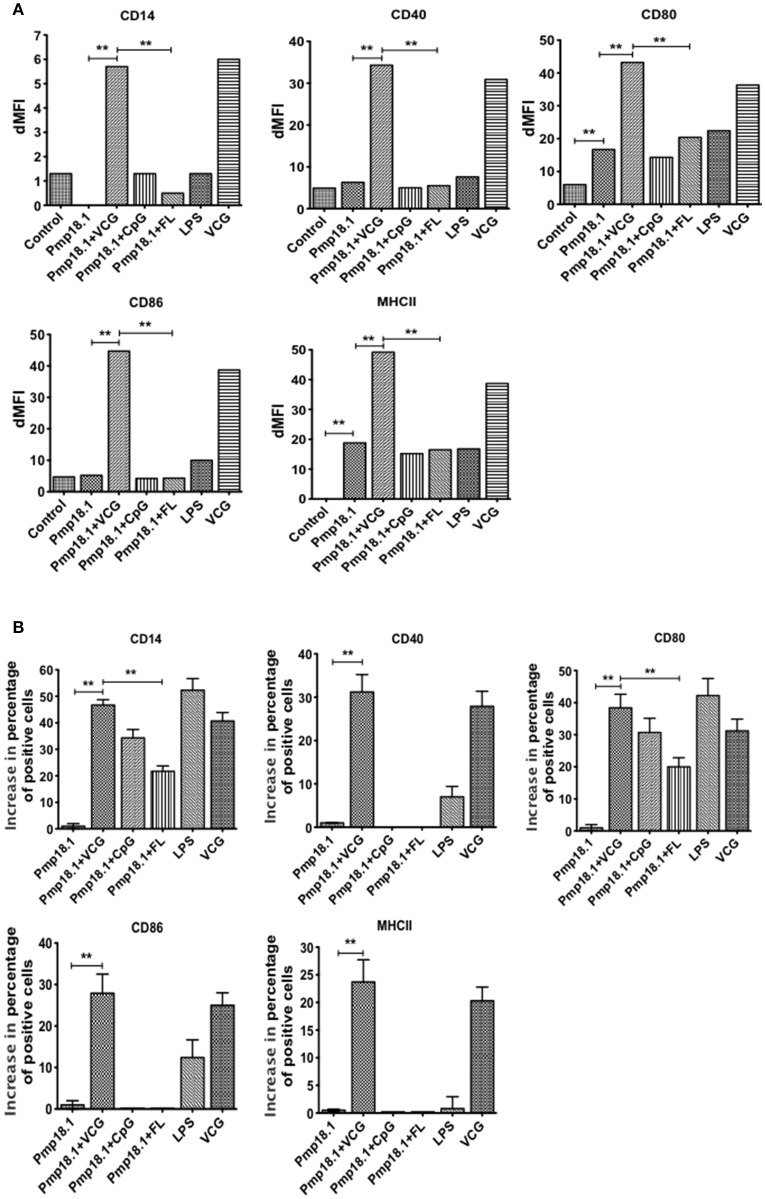
Figure 2.
BMDC surface activation marker expression using FACS analysis. Immature BMDCs were obtained from femurs and tibias of C57BL/6J mice. BMDCs were isolated from mice by established procedures as described previously (Inaba et al., 2001). After 7 days of culture, cells were harvested, counted, and seeded again at 1 × 10⁶ cells per milliliter. Harvested cells were pulsed for 24 h with Pmp18.1 in the presence or absence of VCG, CpG, or FL adjuvants, or LPS (positive control) or medium (negative control) stained with conjugated monoclonal antibodies against CD14, CD40, CD80, CD86, 1Ab, or isotype-matched controls, and quantified in triplicate by flow cytometry. Gating was on CD11c+ DCs and the cells were identified based on light-scatter properties of DCs and CD11c expression (not shown). The data shows (A) a comparison of the differences between the mean fluorescence intensity (MFI) of stained samples and that of unstained samples (dMFIs) and (B) the percentage increase in the number of CD11c+ cells positive for the indicated markers. Data are from one representative experiment of three independent assays performed in duplicates with similar results. Statistical analyses were performed with GraphPad Prism. The statistical significance difference between two groups was evaluated by Student's t-test and between more than two groups by the one-way analysis of variance (ANOVA). Differences were considered to be statistically significant at **p < 0.01.

