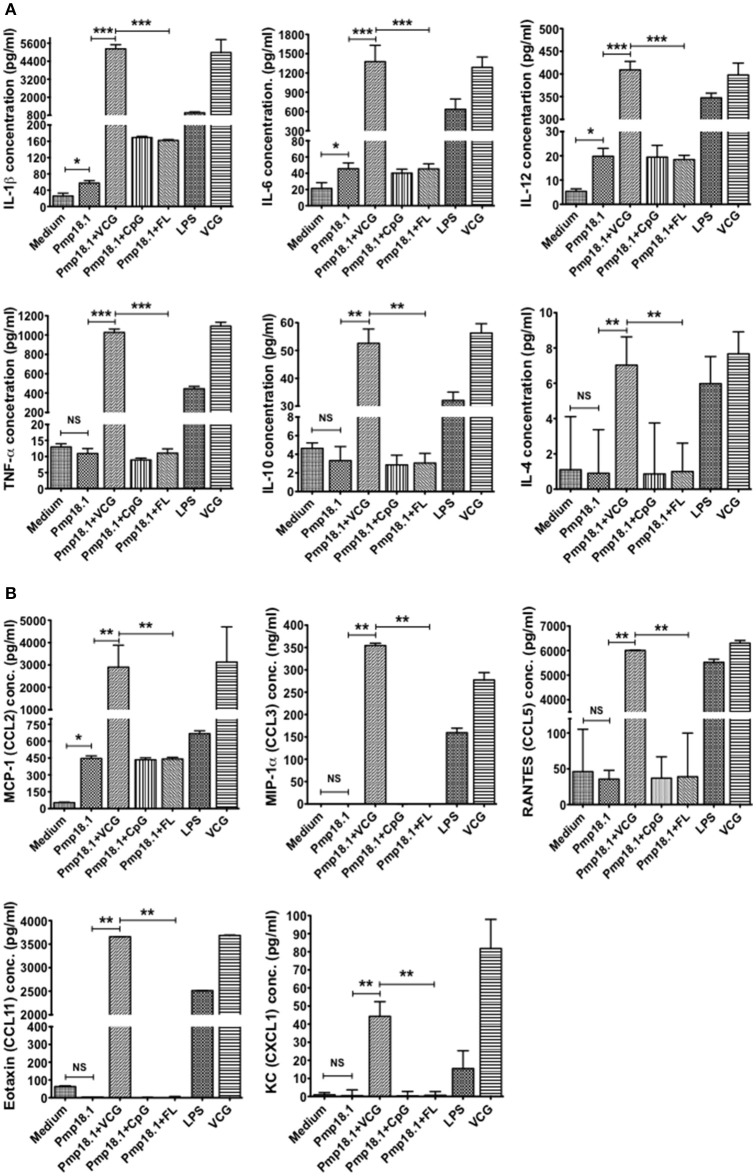
Figure 4.
Activation of cytokine production by Pmp18.1-stimulated BMDCs. DCs were pulsed ex vivo with Pmp18.1 in the presence or absence of VCG, CpG or FL, or LPS (positive control) or medium (negative control) for 24 h. Culture supernatants were collected and assayed for Th1/Th2 cytokines and chemokines by cytokine ELISA using the Bio-Plex cytokine assay kit in combination with the Bio-Plex Manager software. The concentration of the cytokines (A) or chemokines (B) in each sample was obtained by extrapolation from a standard calibration curve generated simultaneously. Data are shown as the mean values (± SD.) for triplicate cultures for each experiment. The results are from two independent experiments. Statistical analyses were performed using the Student's t-test for differences between two groups or one-way analysis of variance ANOVA for differences between more than two treatment groups. Differences were considered to be statistically significant at *p < 0.05 or **p < 0.01 or ***p < 0.001. NS indicates not significant.

