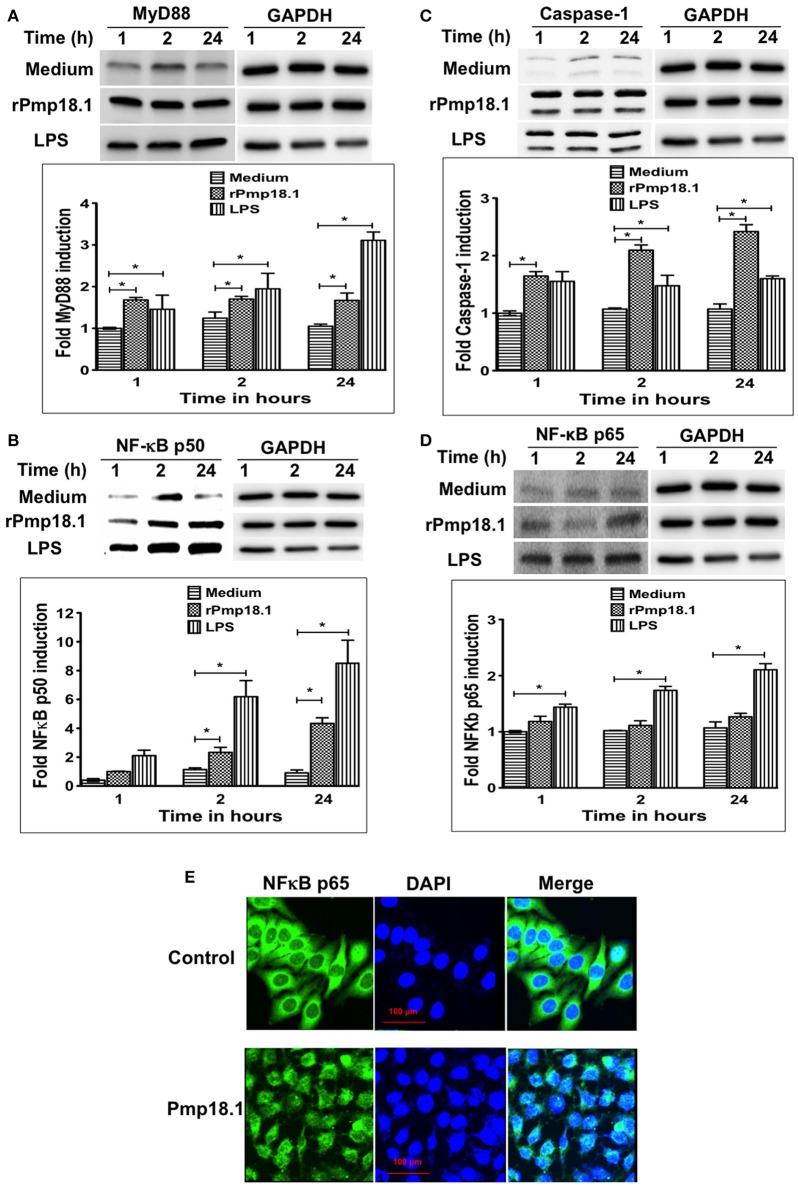
Figure 6.
Pmp18.1 activates MyD88, NFκB and Caspase-1 expression in BMDCs. Cell lysates were prepared from BMDCs incubated with Pmp18.1 (10 μg/ml) for 1, 2, or 24 h. Protein extracts (40 μg/well) were separated by SDS-PAGE and detected by immunoblotting analysis incorporating the Pierce™ ECL Western Blotting Substrate using antibodies to the corresponding proteins. The proteins bands were visualized using the ImageQuant LAS-4000 imaging system. Protein levels, normalized to GAPDH, were then quantified using Image J software. The data shows the expression levels and fold induction of TLR4 (A), MyD88 (B), NF-κB p50 (C), and Caspase-1 (D). Each experiment was repeated at least two times with similar findings. For NF-κB p65 nuclear migration, BMDCs were incubated for 24 h with rPmp18.1 and nuclear NF-κB p65 was detected by confocal microscopy using a FITC conjugated monoclonal antibody to NF-κB p65 (clone D14E12, Cell Signaling Technology). (E) NF-κB p65 unit was stained in green, and nuclei were visualized by DAPI counterstain (blue). Note the diffuse distribution of NF-κB p65 (green) in the nucleus. The statistical significance difference between two groups was evaluated by Student's t-test and between more than two groups by the one-way analysis of variance (ANOVA). Differences were considered to be statistically significant at *p < 0.05.

