Figure 2.
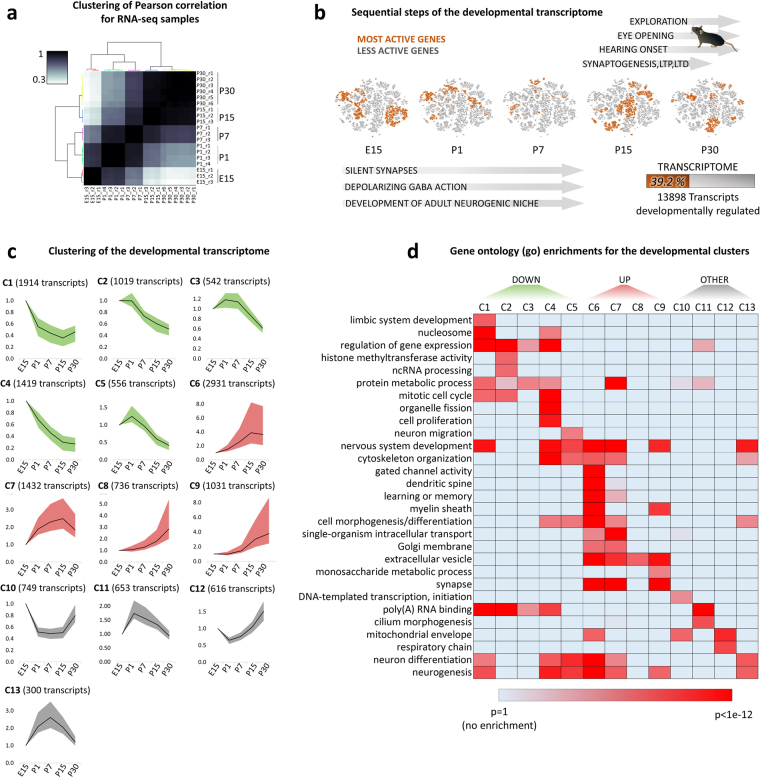
Clustering and functions of the developmental transcriptome. (a) Heat-map of Pearson correlations among different RNA-Seq samples. The most representative genes for the developmental phenotype (top 5000 genes) were used for the calculation of correlations (hierarchical clustering with Ward’s linkage). (b) Overview of hippocampus development. The major perinatal developmental stages are indicated to the side of the t-sne plots of 13898 transcripts (almost 40% of the transcriptome) found to change expression in the course of hippocampal development. Orange colored genes share the same stage of highest expression and become clustered in the t-sne plots. (c) Clustering of the developmental transcriptome (RNA-Seq) in the hippocampus (mean, 25th and 75th percentiles of the expression normalized to E15 stage). (d) GO comparisons, heatmap of Bonferroni corrected p-values.

