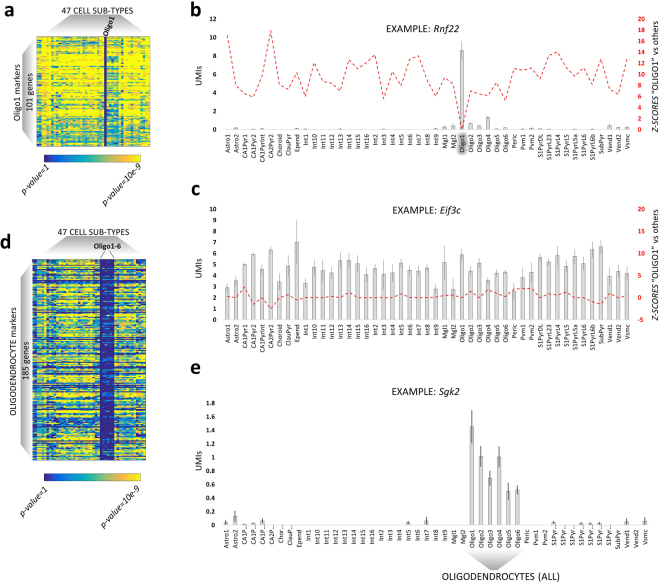
Figure 3.
Calculation of markers of cell type and subtypes. (a) Heatmap representing the markers of Oligo1, a subtype of oligodendrocytes (immature precursors, as defined in8). These markers are significantly more expressed in Oligo1 as they present yellow squares in all the other cell subtype (DESeq 2 corrected p-values). (b) Histogram (mean +/−SEM, standard error of the mean) of the expression levels (UMIs, unique molecular identifiers, normalized for the library size) of Rnf22, a marker of Oligo1. Differential expression analysis (DESeq 2) shows how Rnf22 expression is significantly higher in Oligo1 as compared to any other cell type (red line, p-values in Z-score scale, signed to indicate up/down-regulation). (c) Non-markers genes, such as Eif3c, do not show any significant (red line, Z-scores signed to indicate up/down-regulation) change of expression (UMIs, normalized for the library size) throughout the different cell types. (d) Heatmap representing oligodendrocytes markers: these 185 genes are expressed in all the 6 oligodendrocytes subtypes whilst silenced in the other cell types (DESeq 2 corrected p-values). (e) Histogram (mean +/−SEM) of the expression levels (UMIs, normalized for the library size) of Sgk2, a marker of all oligodendrocytes.

