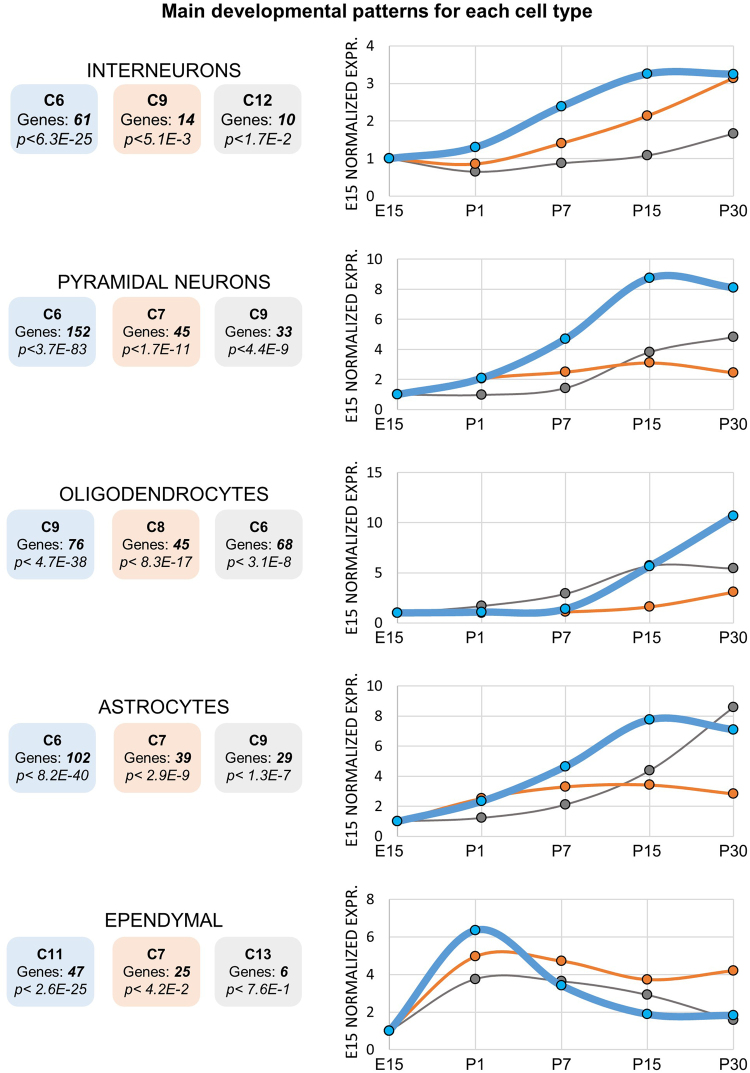
Figure 5.
Developmental profiles of hippocampal cell types. Left) The top three enriched developmental clusters (blue 1st, orange 2nd, gray 3rd) are shown for each cell type, alongside the cluster numbers, number of markers and p-value of enrichment, Bonferroni corrected. Right) The median expression levels of the markers is shown for each cluster (each panel normalized to its own E15 RPKM time point). Blue, orange and gray lines represent the top three enriched clusters.

