Figure 1.
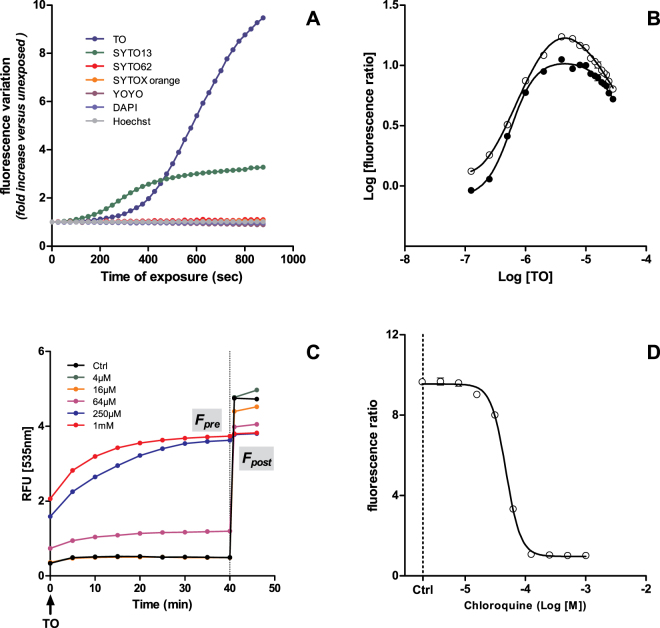
LUCS assay demonstration and optimization on HepG2 cells: (A) light-induced fluorescence observed in live cells treated with seven different cell fluorescent dyes (1 h, 4 µM), then illuminated full power with a Varioskan reader up to 900 s; (B–D) LUCS experiments using thiazole orange (TO): (B) TO (1 h, 0.25–32 µM) dose-dependent evolution of LUCS fluorescence ratios (Fpost/Fpre) with Fpost measured 1 (dark circles) or 60 min (open circles) after light application; (C) fluorescence curves obtained after treatment (24 h) at increasing doses of chloroquine, T = 0: addition of TO 4 µM, T = 40 min, LED illumination (470 nm, 240 mJ/cm2); (D) chloroquine dose-response curve as measured by LUCS fluorescence ratios. Data presented are representative of 2 (A,B) and 6 (C,D) experiments.

