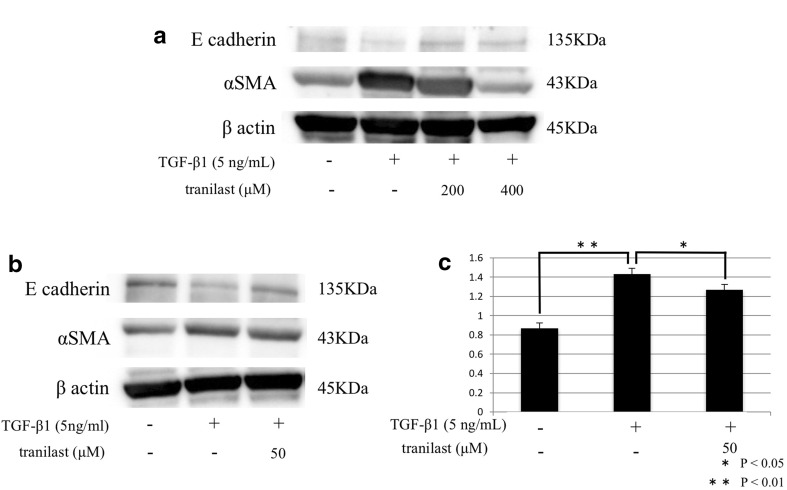
Fig. 3a–c.
Western blot analysis of E-cadherin and α-SMA expression in HPMCs. a α-SMA expression was higher in HPMCs treated with TGF-β than in control cells, and this increase was inhibited by pretreatment with 200 or 400 μM tranilast. E-cadherin expression was attenuated in HPMCs treated with TGF-β, and the expression was reinstated by pretreatment with 200 or 400 μM tranilast. b Tranilast (50 μM) inhibited α-SMA expression and enhanced E-cadherin expression. c Densitometry analyses of α-SMA expression following treatment with 50 μM tranilast were performed in three independent experiments; data are expressed as the mean ± SD. *p < 0.05, **p < 0.01

