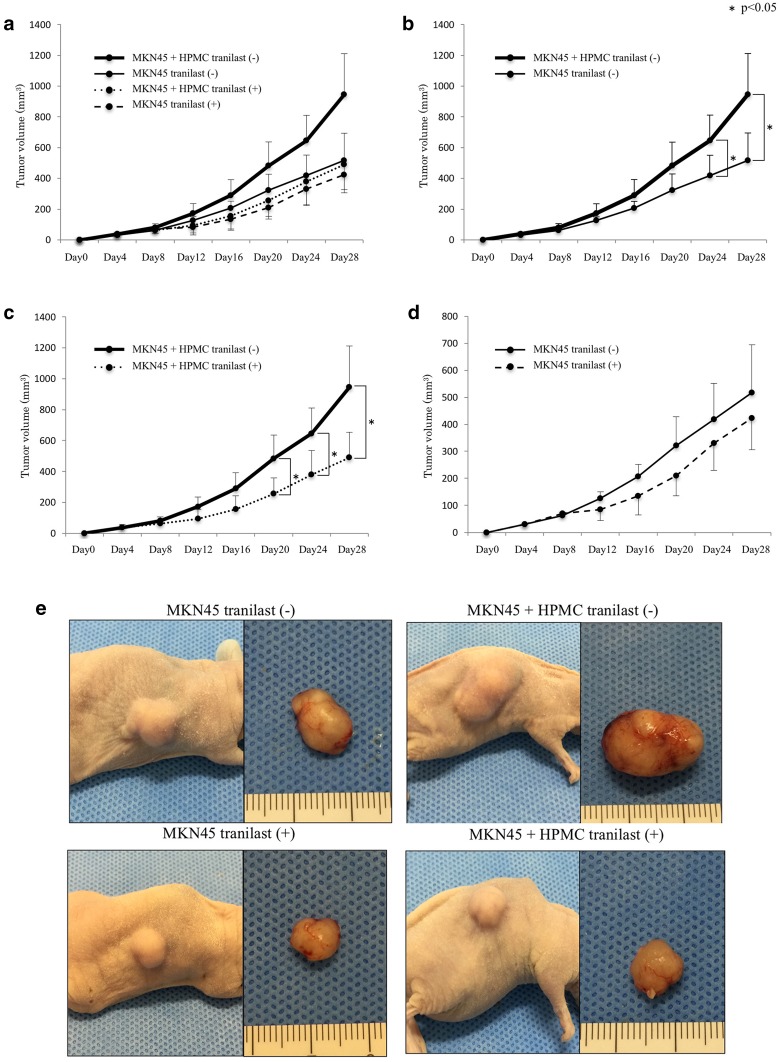
Fig. 6a–e.
Subcutaneous xenograft model to investigate the antifibrotic effects of tranilast. Time course of tumor growth at day 28 in a all four groups, b MKN-45 group without tranilast versus MKN-45 and HPMCs co-culture group without tranilast, c MKN-45 and HPMCs co-culture group with or without tranilast, d MKN-45 group with or without tranilast. Results are expressed as the mean ± SD (n = 6). e Representative images show the macroscopic appearance of tumors at day 28. MKN-45 tranilast (−): MKN-45 without tranilast, MKN-45 tranilast (+): MKN-45 with 200 mg/kg tranilast, MKN-45 + HPMCs tranilast (−): co-culture of MKN-45 and HPMCs without tranilast, MKN-45 + HPMCs tranilast (+): co-culture of MKN-45 and HPMCs with 200 mg/kg tranilast. *p < 0.05

