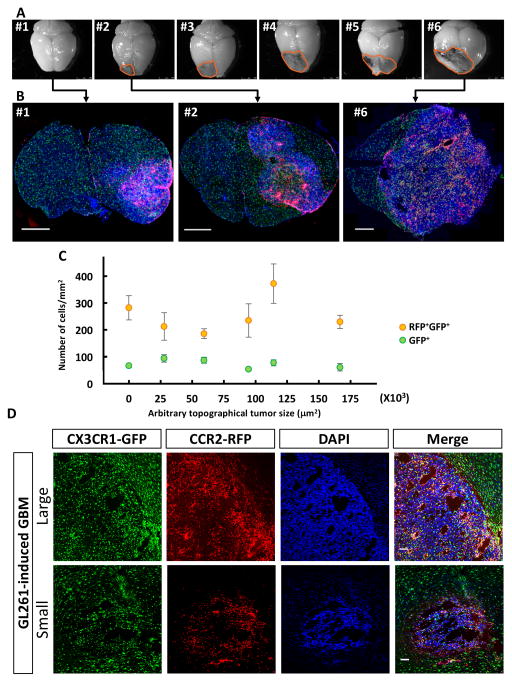
Figure 4. Bone marrow-derived cells infiltrate GBM early during initial tumor formation stage.
(A) Gross examination of brains dissected from Cx3cr1GFP/WT;Ccr2RFP/WT mice euthanized 25 days after transplantation of tumors isolated form RCAS/Ntva donors. (B) Immunofluorescence of coronal brain sections containing tumors at different stages as manifested by small to large sizes. Scale bar = 1 mm. (C) Quantification of GFP+RFP+ double positive or GFP+ single positive cells inside the tumors. One-way ANOVA test does not detect statistical significance between tumors of various sizes. (D) Representative immunofluorescent sections of large (top) and small (bottom) tumors dissected from GL261 model. Scale bar = 100 μm.

