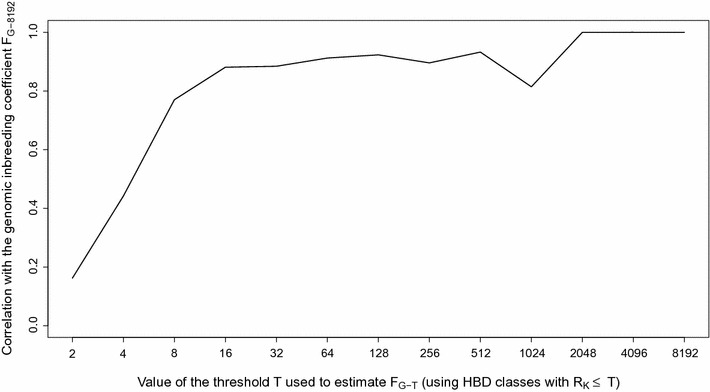
Fig. 2.

Correlations between genomic inbreeding coefficients estimated with respect to different base populations (F G-T) and the inbreeding coefficient estimated with the most remote base population FG-8192 (including all HBD classes). Different base populations are obtained by selecting different thresholds T that determine which HBD-classes are considered in the estimation of F G-T (e.g., setting the base population approximately 0.5 * T generations in the past). The corresponding inbreeding coefficients F G-T are estimated as the probability of belonging to any of the HBD classes with a R k ≤ T averaged over the whole genome. Estimation of inbreeding coefficients was performed with the Mix14R model (13 HBD-classes model with pre-defined R k rates) for 634 Belgian Blue sires and using the BovineHD SNP panel
