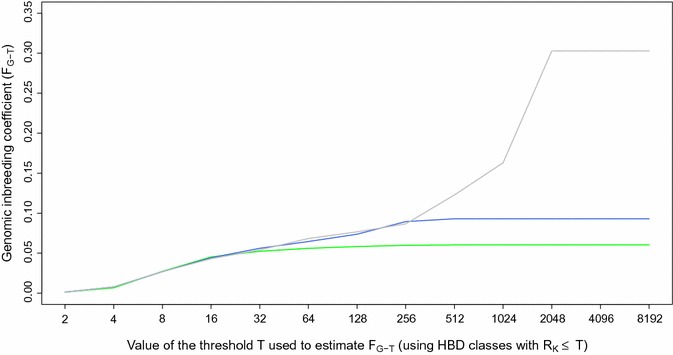
Fig. 4.

Comparison of inbreeding coefficients estimated with different SNP densities (LD panel in green, 50 K panel in blue and BovineHD panel in grey) and for different base populations (the threshold T determines which HBD classes are included in the estimation of F G-T). Estimation of inbreeding coefficients was performed with the Mix14R model for 634 Belgian Blue sires
