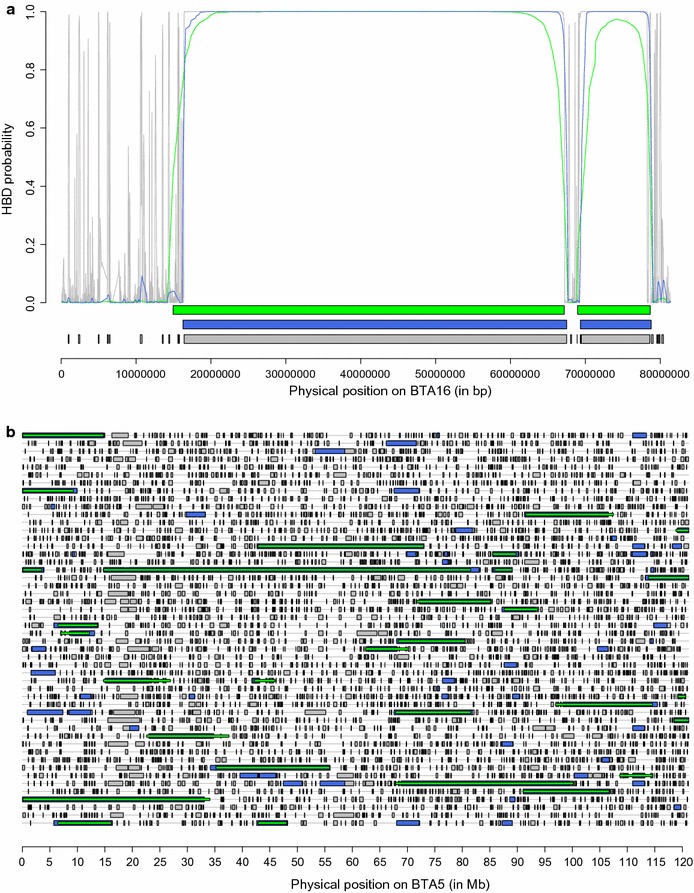
Fig. 5.

Illustrations of the identification of HBD segments using different SNP panels. a Example of estimated HBD probabilities for one individual on Bos taurus autosome (BTA) 16 using different SNP densities (LD panel in green, 50 K panel in blue and BovineHD panel in grey). The horizontal lines below the curves represent HBD segments as identified by the Viterbi algorithm with the three panels. An extremely long HBD segment (~ 50 Mb) is represented (there are only 69 such HBD segments identified in the entire data set), suggesting recent inbreeding. This bull is one of the 29 individuals carrying such long HBD segments and has a pedigree inbreeding coefficient of 0.048. b Comparisons of HBD segments identified for 50 individuals on BTA5 using different panels (each line represents one individual). Segments identified with the HD, 50 K and LD panels are represented in grey, blue and green, respectively (with lower density results masking results obtained at higher density). The shortest HBD segments are identified with the HD panel (indicated in grey) whereas those of intermediate size are also captured with the 50 K panel (and still missed with the LD panel) and indicated in blue. For a few HBD segments, the use of the LD panel results in longer segments
