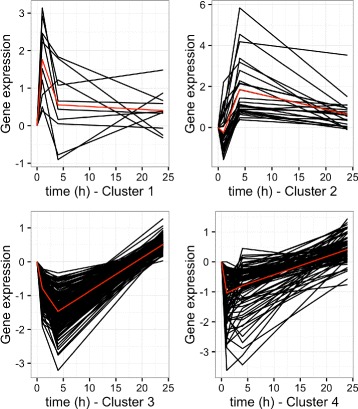
Fig. 3.

Black: Average evolution the genes in each of the clusters identified by the HAC on the 284 DEG identified in list (List1). Evolution of each gene is translated so that it is equal to 0 at t=0; Red: Average evolution over all genes in the cluster (cluster 1: 8 genes, cluster 2: 12 genes, cluster 3: 159 genes, cluster 4: 77 genes). 28 genes were unclassified
