Fig. 4.

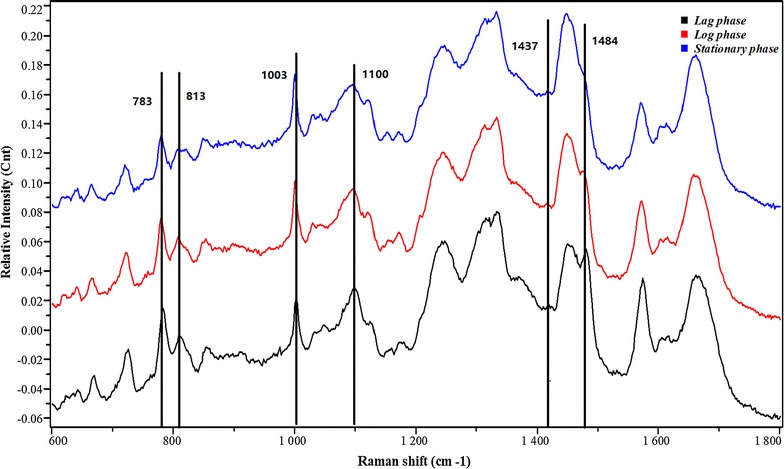
The most significant changes in spectral peaks during three growth phases of the bacterial. The primary Raman peaks that contribute to the data separation in the PCA plots from Fig. 3 are labelled

The most significant changes in spectral peaks during three growth phases of the bacterial. The primary Raman peaks that contribute to the data separation in the PCA plots from Fig. 3 are labelled