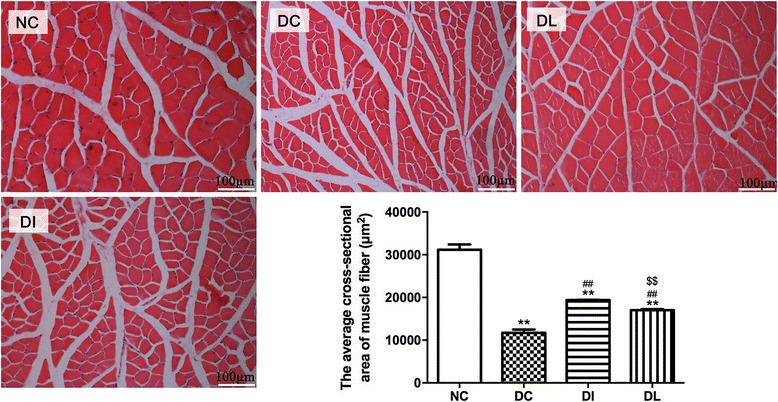
Fig. 5.

Effect of 6-week exposure to LIPUS on gastrocnemius muscle fiber cross-sectional area. Data are expressed as the mean ± SD (n = 8 per group). Each sample represents ten different fields of view; images were taken at ×200 under a light microscope. **P < 0.01 versus NC; ## P < 0.01 versus DC group; $$ P < 0.01 versus DI group
