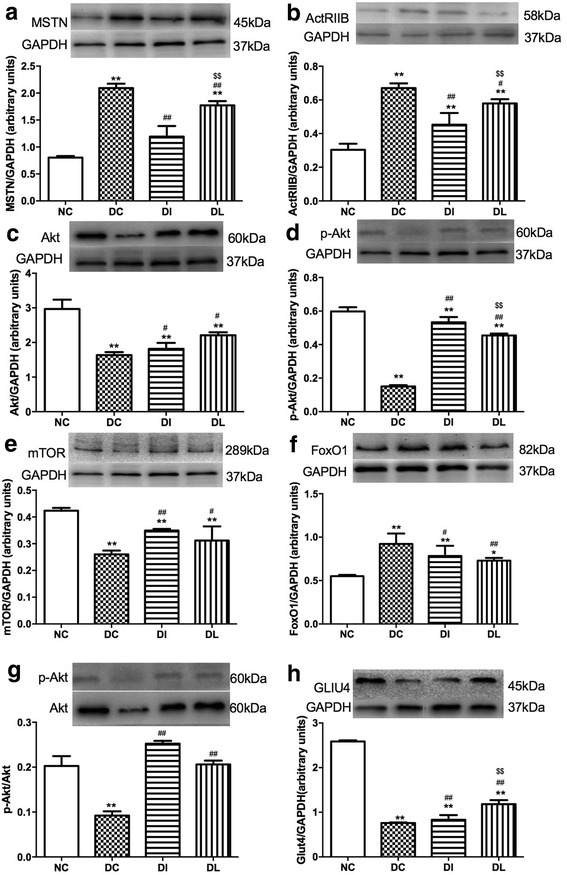
Fig. 7.

Effects of 6-week exposure to LIPUS on the protein expression of MSTN (a), ActRIIB (b), Akt (c), p-Akt (d), mTOR (e), FoxO1 (f), p-Akt/Akt (g), and GLUT4 (h). Data are expressed as the mean ± SD (n = 8 rats per group). *P < 0.05 vs. NC group; **P < 0.01 vs. NC group; # P < 0.05 vs. DC group; ## P < 0.01 vs. DC group; $$ P < 0.01 vs. DI group
