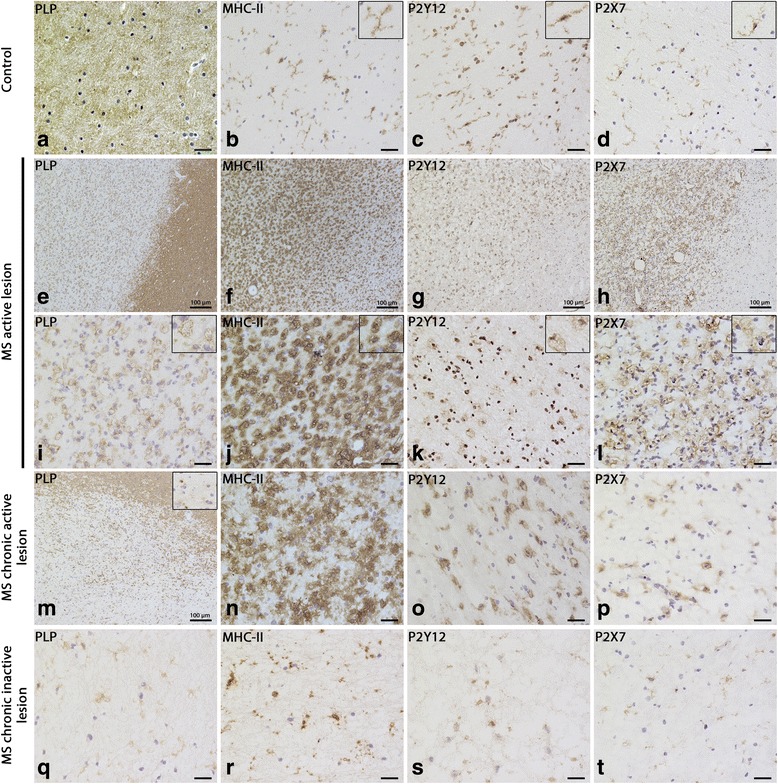
Fig. 2.

Expression of P2Y12R and P2X7R in controls, MS active, chronic active, and inactive lesions. PLP and MHC-II staining in different MS lesions and control (a, b, e, f, i, j, m, n, q, r). P2Y12R and P2X7R expression on ramified microglia in control human brain tissue (c, d). P2Y12R expression in MS active lesion (g, k), chronic active lesion (o), and chronic inactive lesion (s). P2X7R expression in MS active lesion (h, l), chronic active lesion (p), and chronic inactive lesion (t). The images were taken at the middle of the lesion for active sections and at the rim of the lesion for chronic active sections. Scale bar is 20 μm when not specified
