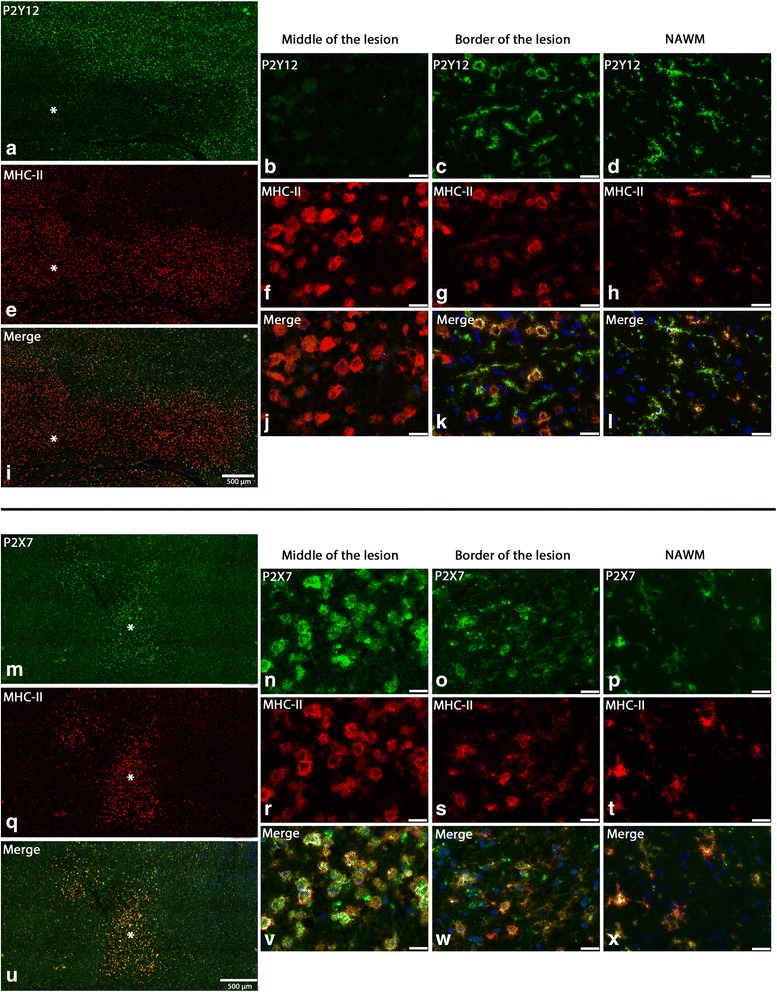
Fig. 3.

Expression of P2Y12R and P2X7R on MHC-II-positive cells in MS active lesion. Low-zoom images showing P2Y12R and MHC-II double staining in MS active lesion (a, e, i); asterisk indicates the center of the lesion. High-magnification images of P2Y12R and MHC-II double staining taken at the center of the lesion (b, f, j), the border of the lesion (c, g, k), and the NAWM (d, h, l). Low-zoom images showing P2X7R and MHC-II double staining in MS active lesion (m, q, u). High-magnification images of P2X7R and MHC-II double staining taken at the center of the lesion (n, r, v), the border of the lesion (o, s, w), and the NAWM (p, t, x). All images were acquired in the same session using same exposure time between different areas to allow comparison. Blue is nuclear staining with Hoechst. Scale bar is 25 μm when not specified
