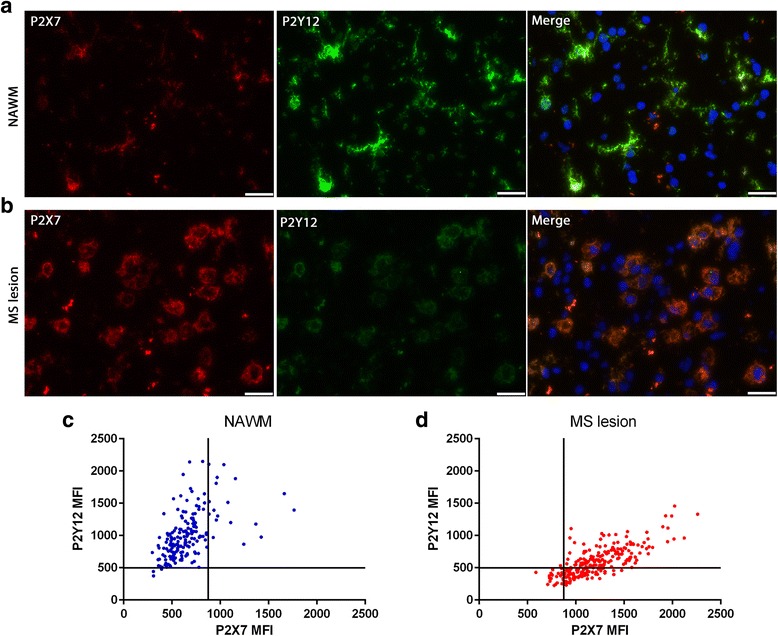
Fig. 4.

Expression of P2Y12R and P2X7R on microglia in NAWM and human MS active lesion. Double staining showing the expression of P2Y12R and P2X7R in NAWM (a) and MS active lesion (b). Images were collected from the same section with the same exposure time between different areas to allow comparison. Scatter plot showing quantification of P2Y12R and P2X7R fluorescence mean intensity (MFI) on microglia in NAWM (179 cells quantified) (c), and active MS lesion (241 cells quantified) (d). Each dot represents a single cell. All images for quantification were collected from a single section and were acquired in a single imaging session with the same exposure time. Regions of interest (ROIs) were drawn manually delineating each cell using Leica LAS AF software
