Fig. 6.

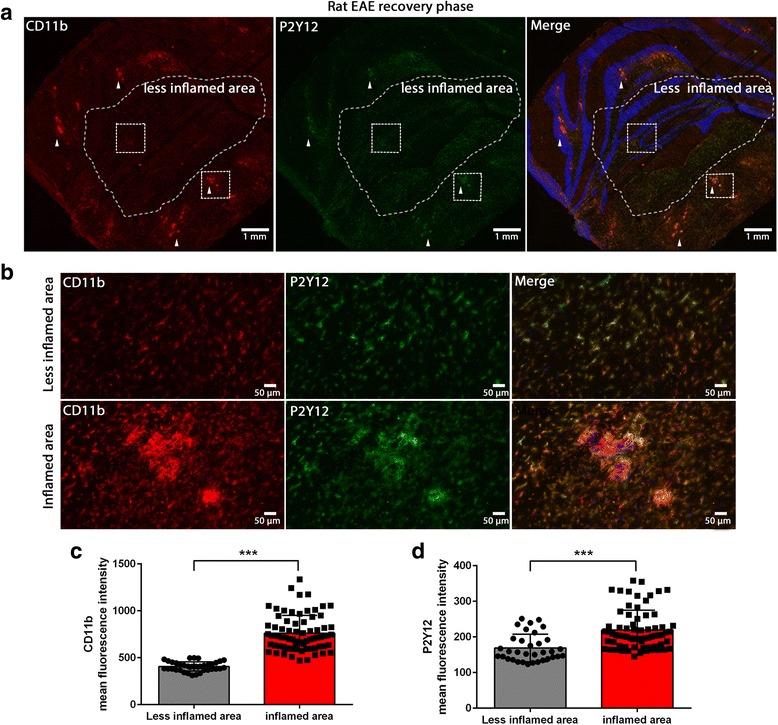
P2Y12R expression is upregulated on activated microglia in EAE in the recovery phase. P2Y12R and CD11b double staining on EAE tissues from the recovery phase showing a highly infiltrated and inflamed area, and a less inflamed area. Arrow head shows high P2Y12R staining on CD11b positive cells (a). Higher magnification images of P2Y12R and CD11b staining showing an increase of P2Y12R expression on microglia in the high inflamed area compared the less inflamed area (b). Fluorescence quantification of CD11b (c) and P2Y12R (d) showing a significant increase in CD11b and P2Y12R expression in the highly inflamed area compared to the less inflamed area. Each circle and square represents one drawn region of interest (ROI) and represents tissues from three different rats. Different groups were compared using student t-test, (one asterisk) p < 0.05, (three asterisks) p < 0.0001. Blue is nuclear staining with DAPI
