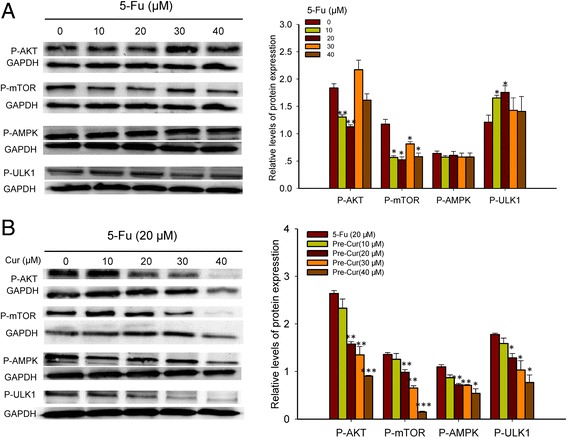
Fig. 4.

Analysis of P-Akt, P-mTOR, P-AMPK and P-ULK1 expression levels in HCT116 cells. a. Treatment for 24 h by varied concentrations of 5-Fu alone. b. The pre-Cur treatment (varied concentrations of curcumin and 20 μM 5-Fu). *, p < 0.05, **, p < 0.01, and ***, p < 0.001, compared to the vehicle (0 μM 5-Fu or 0 μM curcumin) cell group
