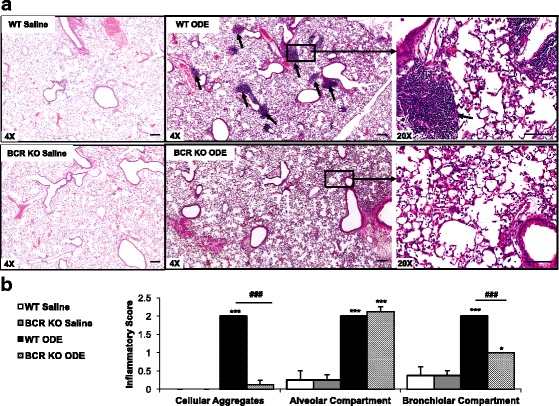
Fig. 2.

B cells are essential for the formation of ODE-induced peribronchiolar cellular aggregates, but do not explain alveolar compartment inflammation. WT and BCR KO mice were repetitively exposed to saline or ODE for 3 weeks. Whole lung sections (4-5-μm) were stained with hematoxylin and eosin. a A representative lung section from each treatment group is shown at 4X magnification. A 20X magnification image of boxed area depicted in 4X image of WT and BCR KO + ODE is shown on far right panel. Short arrows indicate cellular aggregates. b Bar graph depicts mean with standard error bars of the semi-quantitative degree and distribution of lung cellular aggregates, alveolar inflammation, and bronchiolar inflammation with N = 4-6 mice/group. Line scale is 100 μm. Statistical difference (*p < 0.05, ***p < 0.01) vs. matched saline. ###p < 0.001 is significant difference between WT and BCR KO animals
