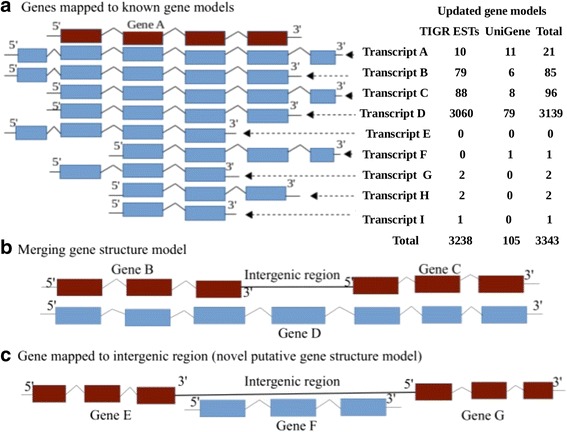
Fig. 1.

Schematic gene structure model for annotation comparison. In this figure, there are three representations of gene structure models. a represents hypothetical map of transcripts to the existing gene model (EGM): ‘Gene A’ denotes a hypothetical EGM to which all transcripts overlapped showing a specific type of updated gene model. Transcript A, B and C each represents an extended overlapping gene at both 5′ and 3′ edges, at only 5′ edge but sharing start position at 3′ edge and at only 3′ edge but sharing start position at 5′ edge respectively. Transcript D represents perfect overlapping gene that conform or share start position at 5′ and stop at 3′ edges. Transcript E and F represent partial overlapping at one edge and extension at another where the former partially overlapped at 3′ and extended at 5′ edge and the latter with an exact opposite pattern. Transcript G and H each denotes a partial overlapping gene that shares start position at 5′ edge and at 3′ edge respectively. Transcript I represents an inner overlapping gene. The values given corresponding to each overlapping transcript in a describe the actual number of modified genes in our finding based on TIGR DRESTs and UniGene datasets. b represents cross-genic overlapping (merged gene structure model) where two separate EGMs, ‘Gene B’ and ‘Gene C’ were assumed to be merged into a single gene model, ‘Gene D’. c represents an illustration of a NGSM ‘Gene F’ that mapped to an intergenic region between the two EGMs ‘Gene E’ and ‘Gene G’ that represent the left and right nearest neighbouring genes respectively. The gene names denote arbitrary example. Each bar represents exon structure and the inverted ‘v’ shaped structure positioned between any two adjacent bars represents intron splicing. The gene model structure with red bars denote EGMs and those with blue are assumed to represent the currently identified genes that mapped to EGMs (transcript A-I), merged gene (‘Gene D’) and NGSM (‘Gene F’). This schematic gene structure model assumes both strand orientations based on the pattern of loci overlapping observed in our results
