Fig. 10.
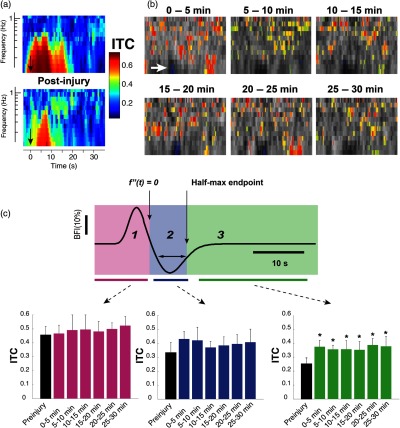
ITC alterations following controlled cortical injury. (a) Representative spectrograms depicting the absolute magnitude of ITC before (top) and after (bottom) injury. These particular spectrograms are derived from the same animal as in Fig. 9(a). The color definitions are as indicated in the ITC colorbar; a value of 1 represents perfect, in-phase spectral responses. While the depicted values are real values, they represent the absolute magnitude of complex values that originally contain phase information. The black arrows indicate the time point at which forelimb stimulation was applied. (b) A series of ITC spectrograms, averaged over all animals, showing features that differ significantly from preinjury with obtained from a two-tailed student’s t-test. As in Fig. 9(b), the statistically significant pixels, which are color-coded according to the colorbar of (a), are superimposed on a grayscale spectrogram representing the postinjury ITC spectrogram from which preinjury spectrogram values have been subtracted. While most of the changes represent increases in ITC at time points following the initial waveform peak and undershoot, there was a significant decrease in ITC in the region of the undershoot itself, roughly the area of frequencies below 0.4 Hz between 12- and 16-s poststimulus (indicated by the white arrow in the top left superimposed image). (c) Regional assessment of ITC changes following injury. A sample waveform fit divided into three regions for assessing changes in ITC at particular phases of the functional blood flow response is shown on top. The specific regions were defined as (1) an initial “rise” extending from the time directly after sensory stimulation cessation up through the point where the second derivative of the fit passes zero; (2) the undershoot period, extending from the end of (1) through the latest point of intersection of the fit with the undershoot half-maximum (or minimum, here) line; (3) the period of time following the main two phases of the waveform and extending until the subsequent stimulus period. Asterisks in the right-most bar chart on the bottom indicate values that differ from baseline, preinjury values with according to a two-tailed Student’s t-test.

