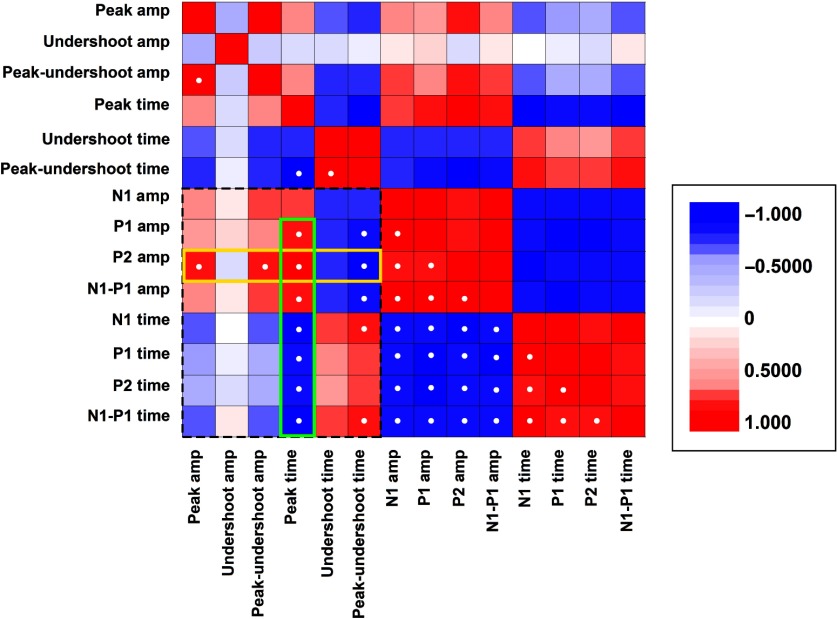
Fig. 11.
Correlation matrix comparing the post-CCI recovery trends for the prominent features of the CBF and SSEP responses. Each matrix element represents the Pearson’s correlation coefficient obtained by comparing the post-CCI time course (as in Figs. 4 and 5) of the major peaks and latencies. A correlation coefficient value of 1 represents identical waveforms, indicates that the two traces are perfectly anticorrelated. The matrix is symmetrical about the diagonal. Correlation coefficients with an absolute value higher than 0.8 are indicated with white dots. The dotted rectangular perimeter delimits the matrix region representing correlation between the two modalities, optical and electrophysiological. The yellow perimeter highlights the high correlation between the P2 amplitude and postinjury hemodynamics, whereas the green perimeter highlights the fact that the peak latency is highly correlated with all aspects of SSEPs.

