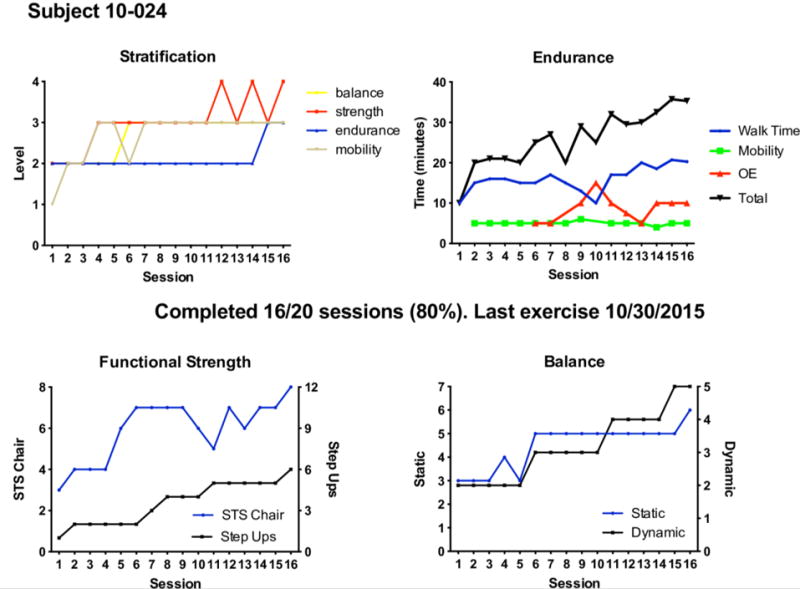
Fig 4. Patient Progress Report Example #1.

The PPR reflects the attendance and progress of a patient actively engaged in the REHAB-HF intervention. The stratification grid graph (upper left) details progress in functional performance levels (1, lowest to 4, highest, See Table 2) over time. The endurance graph (upper right) provides progress on time spent in walking, other endurance (OE) activity (i.e., stationary bicycle), and mobility activities. The total time (black line) is the summation of all endurance activity time. The functional strength graph (lower left) displays progress in sit-to-stand (STS; x-axis 1 corresponds to exercise Level 1, 8 corresponds to Level 4b in the Intervention MOP) and step-up (x-axis 1 corresponds to exercise Level 1a, 12 corresponds to exercise Level 4c in the Intervention MOP). The balance graph (lower right) shows progress in static balance (x-axis 1 corresponds to exercise Level 1a, 7 corresponds to maintenance in the Intervention MOP) and dynamic balance (x-axis 1 corresponds to exercise Level 1a, 5 corresponds to exercise Level 4 in the Intervention MOP). In this example, the participant attended 16 of a possible 20 sessions (80% attendance) and the last date the participant attended a session is displayed. Overall, the participant is progressing in all domains as noted by the increased time and exercise levels achieved over the sessions. Note that as functional strength and balance improved, so did the capacity for endurance/sustained walking. For descriptions of exercise Levels, see Supplementary File 1. REHAB-HF Study Intervention MOP or Supplementary File 2. REHAB-HF Exercise Guide.
