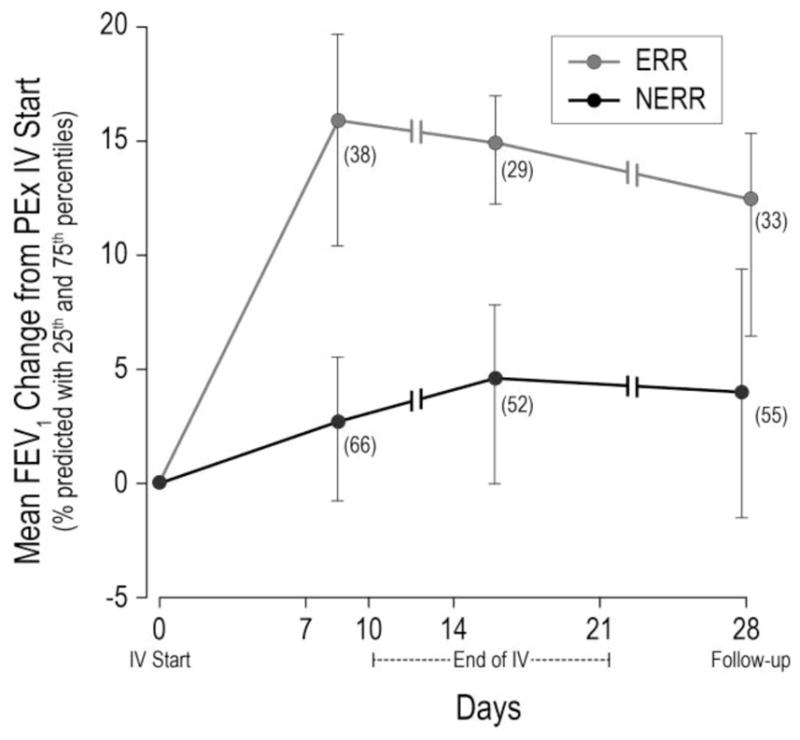
Figure 3. Mean absolute change in FEV1 % predicted in STOP adults.

from start of IV antibiotic treatment to Day 7–10, end of IV treatment, and Day 28, by ERR (FEV1 ≥ 8% and CRISS improvement ≥11) and NERR (FEV1 < 8% or CRISS improvement <11). Vertical lines span from 25th to 75th percentiles; n at each time point shown on figure.
