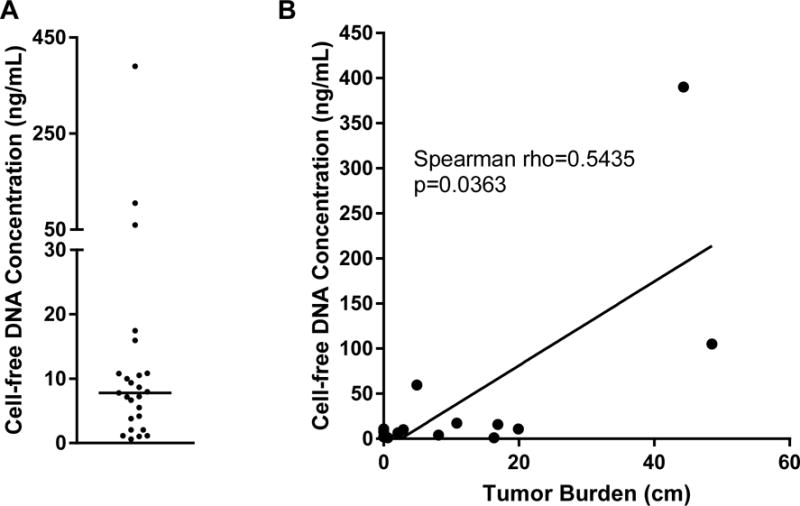
Figure 1. Measurement of cfDNA yield and correlation with tumor burden.

Blood was obtained in Streck DNA BCT tubes for 25 advanced melanoma patients, plasma processed within 36 hours of blood draw, and cfDNA extracted. Shown are the A. cfDNA yield per mL of plasma (horizontal line indicates median=7.8 ng/mL, range 0.6 to 390.0 ng/mL), and the B. Relationship between cfDNA concentration and tumor burden, calculated as the sum of the long diameter of all measurable lesions as detected by imaging at the timepoint closest to blood draw, with not more than one month elapsing between imaging and blood draw. Shown are the results for the 15 patients for whom tumor burden could be measured.
