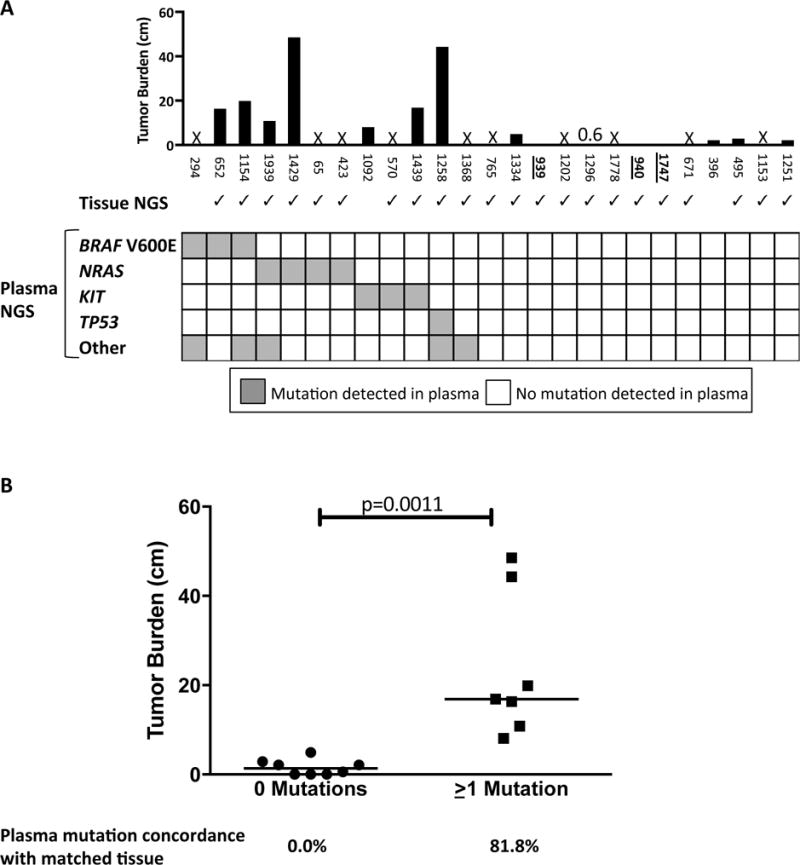
Figure 3. Comparison of tumor burden as measured by imaging to mutations detected in cfDNA.

A. The black bars depict the total tumor burden (in cm) for each patient as measured by imaging conducted within one month of blood draw (see detailed measurements in Supplemental Table 2). The three patients whose numbers are bolded and underlined, 939, 940, and 1747, were determined by imaging to have no evidence of disease. An “X” indicates that tumor burden for that patient was not assessable within one month of blood draw. This was the case for 10 patients. Immediately below the bar chart, checkmarks indicate the 22 patients for whom tissue NGS was conducted. Below the check marks is a grid detailing all mutations detected for each of the 25 patients with plasma testing. Three of the NRAS mutations were Q61K, and the fourth was Q61R. The number of mutations detected per patient ranged from zero (depicted by all white squares) to two, with detected mutations depicted in grey. B. For the 15 patients with imaging-assessable tumor burden, shown is a comparison of the tumor burden for the 8 patients with no detected mutations compared to the 7 patients with one or more mutations detected in plasma. The concordance rates for any mutations detected in plasma are shown immediately below the dotplot. Horizontal line indicates the median values.
