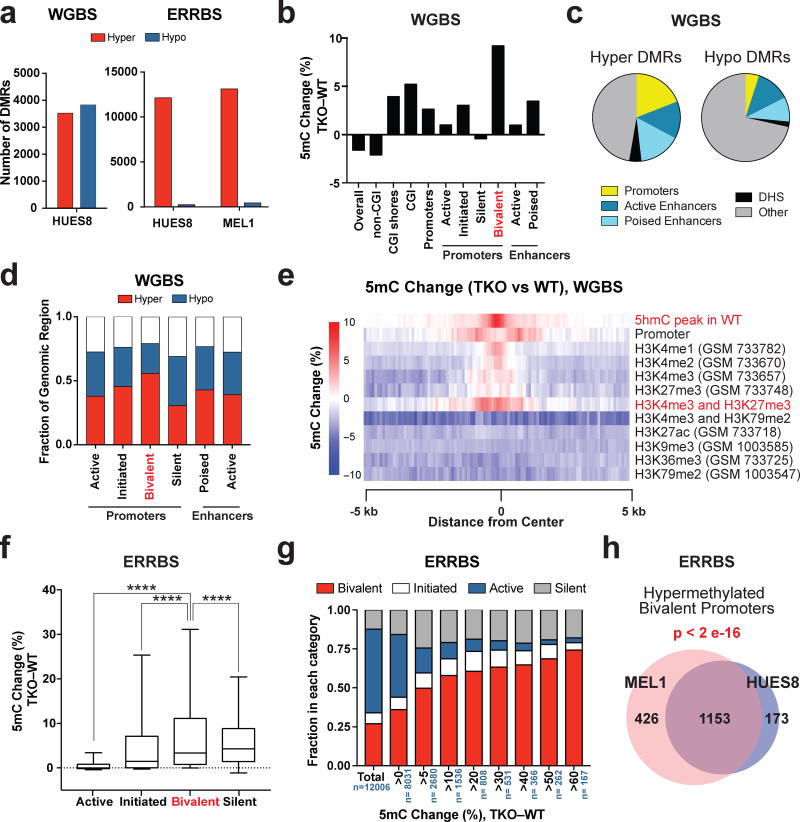
Figure 2. Hypermethylation of bivalent promoters in TET TKO hESCs.
a, Total number of hyper-DMRs (TKO vs. WT) for HUES8 and MEL1 TKO lines compared to HUES8 and MEL1 WT lines by whole genome bisulfite sequencing (WGBS, left) and enhanced reduced representation bisulfite sequencing (ERRBS, right). b, Average percent DNA methylation change between HUES8 TKO and WT hESCs by WGBS at different genomic regions. The definitions for the different genomic regions can be found in the Methods section. c, Enrichment of various regulatory regions in hyper and hypo-DMRs by WGBS. (DHS) DNase I Hypersensitive sites. The definitions for the different genomic regions can be found in the Methods section. d, Fraction of genomic regions that show >5% increase in 5mC (Hyper) or a >5% decrease in 5mC (Hypo) in methylation between TKO and WT hESCs by WGBS of HUES8 WT and TKO hESCs. e,, Heat map of the average 5mC level differences between HUES8 TKO and WT hESCs at the center of the annotated histone modifications by WGBS. f, DNA methylation change between HUES8 TKO and WT hESCs by ERRBS at different promoter types. Box and whisker plots were generated using the methylation change at individual promoters. The error bars show 10 and 90 percent confidence intervals and the bar at the center of the box and whisker plot indicates the median. The promoters are divided into four groups based on histone modification patterns. The details of promoter definitions can be found in the Methods section, n= 2 independent experiments. Statistical analysis: one-way ANOVA, ****P<0.0001. g, Representation of active, initiated, bivalent and silent promoters among promoters that show different degrees of methylation change between HUES8 TKO and HUES8 WT hESCs by ERRBS, n indicates the total number of promoters in each DNA methylation change group, n= 2 independent experiments. h, Overlap of the bivalent promoters that show greater than 5% methylation increase in HUES8 and MEL1 TKO lines compared to HUES8 and MEL1 WT lines by ERRBS. The p-value for the overlap between HUES8 and MEL1 hypermethylation at bivalent promoters is given (Fisher’s exact test). WGBS: n = 1 independent experiment, ERRBS: n = 2 independent experiments (2 independent experiments for HUES8 WT and HUES8 TKO, 2 independent experiments for MEL1 WT and MEL1 TKO).

