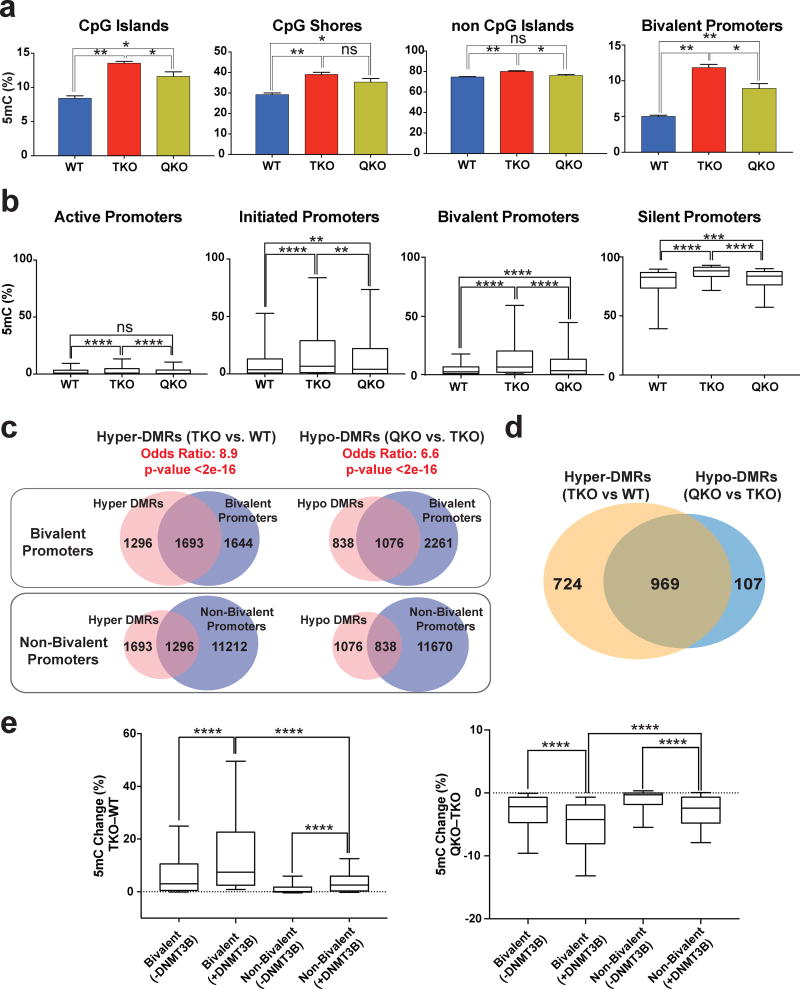
Figure 8. DNMT3B regulates the methylation level at bivalent promoters.
a, Average methylation at different genomic regions and bivalent promoters for WT, TKO and QKO hESCs by enhanced reduced representation bisulfite sequencing (ERRBS), n = 2 independent experiments. Data presented are mean ± STD. Statistical analysis: one-way ANOVA, *P<0.05,**P<0.01. b, Percent methylation in WT, TKO and QKO hESCs for active, initiated, bivalent and silent promoters. Error bars show 10 and 90 percent confidence intervals and the bar at the center of the box and whisker plot indicates the median, n = 2 independent experiments. Statistical analysis: one-way ANOVA, **P<0.01,***P<0.001, ****P<0.0001. c, Top: Overlap of bivalent promoters with hyper-DMRs at promoter regions (TKO vs. WT) and hypo-DMRs at promoter regions (QKO vs. TKO). Bottom: Overlap of non-bivalent promoters with hyper-DMRs at promoter regions (TKO vs. WT) and hypo-DMRs at promoter regions (QKO vs. TKO). The odd’s ratio and p-value for a comparison between bivalent and non-bivalent promoters is provided (Fisher’s exact test). d, The overlap between hyper-DMR (TKO vs. WT) associated bivalent promoters and hypo-DMR (QKO vs. TKO) associated bivalent promoters. e, Left: Methylation change (TKO – WT) for bivalent and non-bivalent promoters that either have DNMT3B peaks in TKO hESCs (+DNMT3B) or do not have DNMT3B peaks in TKO hESCs (−DNMT3B). Right: Methylation change (QKO – TKO) for bivalent and non-bivalent promoters that either have DNMT3B peaks in TKO hESCs (+DNMT3B) or do not have DNMT3B peaks in TKO hESCs (−DNMT3B). Error bars show 10 and 90 percent confidence intervals and the bar at the center of the box and whisker plot indicates the median, n = 2 independent experiments. Statistical analysis: one-way ANOVA, ****P<0.0001.

