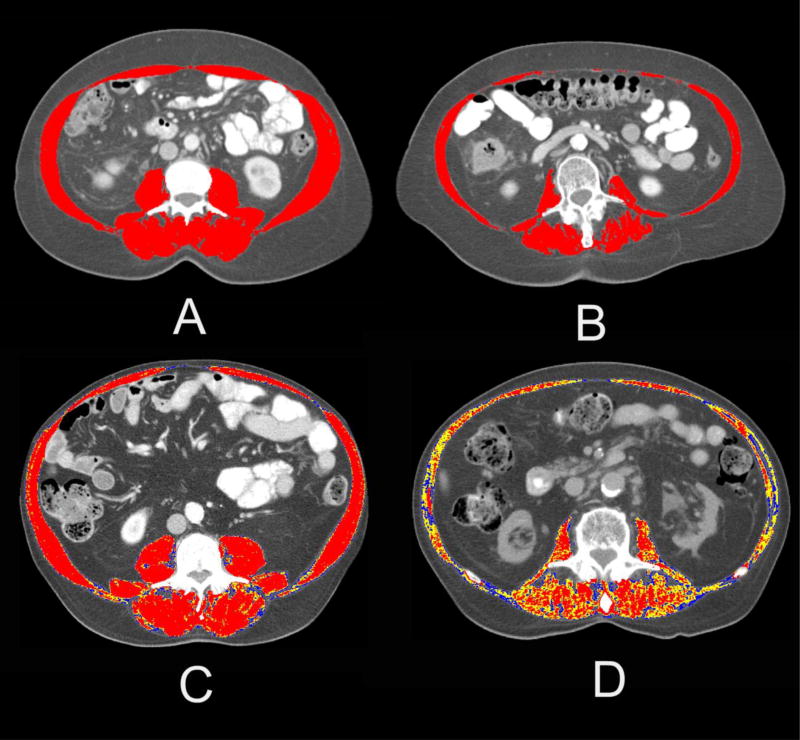
Figure 1. Examples of representative abdominal Computerized Tomography (CT) images.
Images A and B illustrate differences in skeletal muscle mass in patients with the same BMI (BMI=25). For the top portion of the figure, the red area highlights the skeletal muscle area between −29 and +150 Hounsfield Units (HU). Images C and D represent two patients with contrasting values of muscle radiodensity. For the lower portion of the figure, the red area represents skeletal muscle within the normal range of radiodensity (+30 to +150 HU), the yellow represents +1 to +29 HU, and the blue represents 0 to −29 HU.

