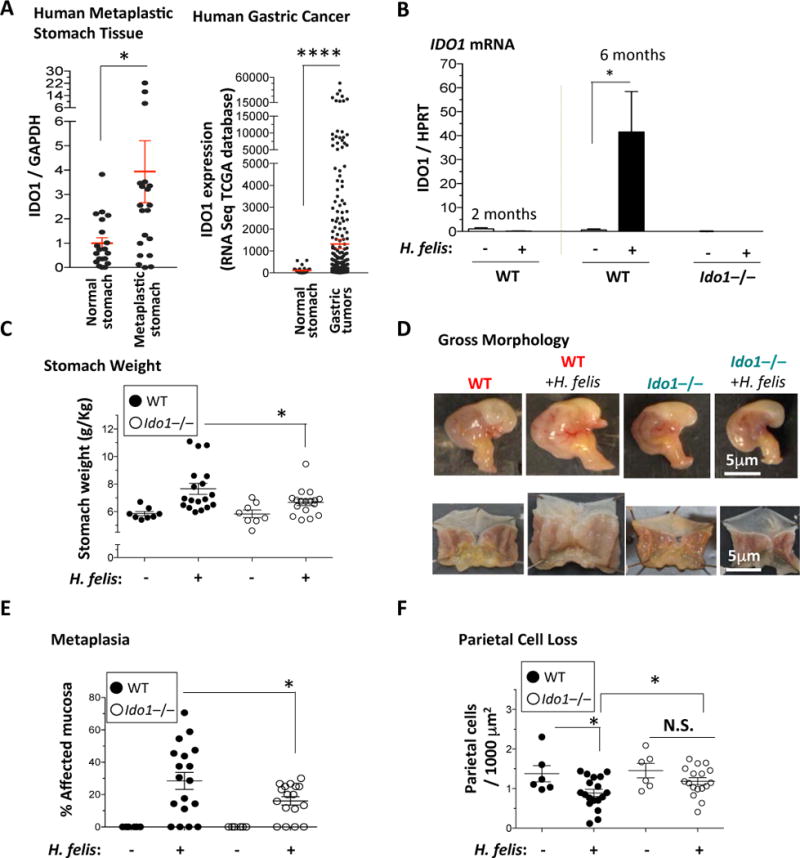
Figure 1. IDO1 deletion reduces gastric hypertrophy, metaplastic lesions and parietal cell loss.

A) Left Panel, RT-qPCR of IDO1 mRNA expression (relative to GAPDH) in human gastric metaplasia samples relative to normal stomach. Right Panel, IDO1 mRNA expression levels by RNASeq in gastric tumor versus normal stomach tissue obtained from TCGA. Each dot represents tissue from one patient. B) RT-qPCR analysis of IDO1 mRNA in 2 months and 6 months H. felis-infected WT stomachs versus uninfected, and 6 months H. felis-infected Ido1−/− stomachs versus uninfected. C) Stomach weight normalized to total body weight in WT versus Ido1−/− mice +/− 6-month H. felis infection. D) Representative images showing the gross morphological appearance of WT versus Ido1−/− mouse stomachs +/− H. felis. E) Scatterplot showing the percentage area of metaplastic gastric mucosa in WT versus Ido1−/− mice +/− 6-month H. felis. Metaplasia was assessed and quantified using trefoil factor 2 (TFF-2) and intrinsic factor (IF) as shown in Suppl. Fig. 3A. F) Scatterplot showing the number of parietal cells per 1,000 μm2 of glandular tissue in WT versus Ido1−/− mice +/− 6-month H. felis. Parietal cells were quantified using Fiji (ImageJ) and the fluorescent staining described in Suppl. Fig. 3B. N = 5 mice per uninfected group, 18 mice in the infected WT group, and 17 mice in the infected Ido1−/− group. Error bars represent the means and standard error of the means. Data were compared using one-way analysis of variance (ANOVA) with Dunnet’s (parametric) or Dunn’s (non-parametric) for multiple comparison tests (Prism), and unpaired t-test (parametric) or Mann-Whitney test (non-parametric) for single comparisons (Prism). Each data point represents one mouse. * P < 0.05. ** P < 0.01. **** P < 0.0001. N.S. = not significant.
