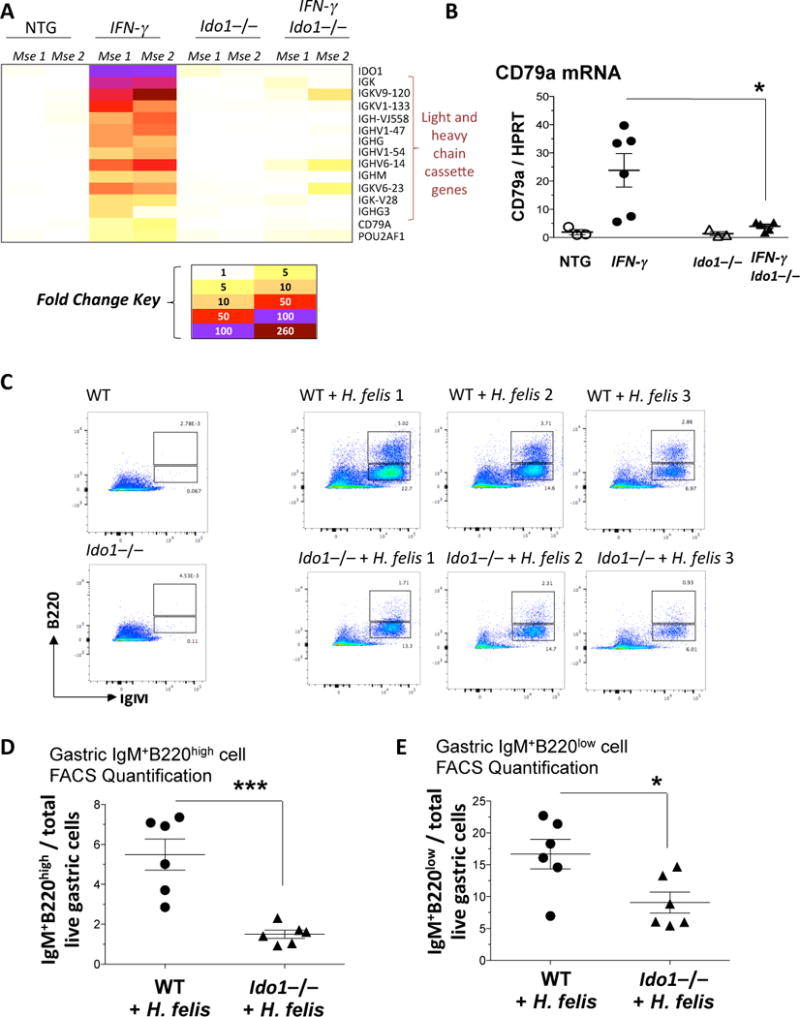
Figure 2. Ido1−/− stomachs display a B cell-deficient phenotype.

A) Fold change heatmap of the differentially regulated genes induced in 2 month old IFN-γ but not in IFN-γIdo1−/− stomachs. B) RT-qPCR of the B cell marker, CD79a, in IFN-γ versus IFN-γIdo1−/− stomachs (2 month old), relative to non-transgenic controls. C) FACS analysis of immature naïve (IgM+B220low) and mature naïve (IgM+B220high) B cells in WT versus Ido1−/− stomachs +/− H. felis following 6 month infection. D) Graphical representation of FACS mature naïve (IgM+B220high) B cell percentages in H. felis-infected WT versus Ido1−/− stomachs. E) Graphical representation of FACS immature naïve (IgM+B220low) B cell percentages in H. felis-infected WT versus Ido1−/− stomachs. Error bars represent the standard error of the mean. Each data point represents one mouse. * P < 0.05. *** P < 0.001.
