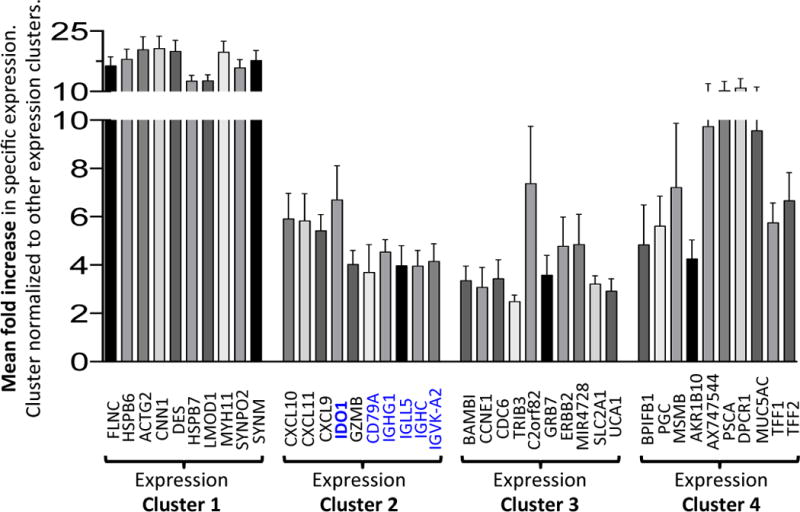
Figure 6. List of the top cluster-specific genes for each human expression cluster.

Bar graph showing the top 10 most up-regulated genes in each expression cluster defined by the TCGA study17. IDO1 and B cell-specific genes (CD79A, IGHG1, IGLL5, IGHC and IGVK-A2) are highlighted in blue font. For each gene, the values represent the mean fold change in expression across the samples in that cluster. Error bars = mean +/− SEM.
