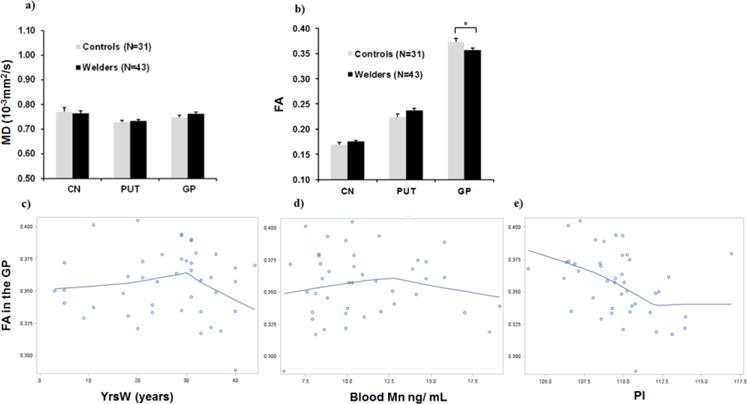
Figure 2.

MRI Diffusion tensor imaging (DTI) in basal ganglia regions of interest [caudate nucleus (CN), putamen (PUT), globus pallidus (GP)] a) Mean diffusivity (MD); b) Fractional anisotropy (FA). Data represent the mean ± standard errors (SEM). The FA difference in the GP between welders and controls is significant (raw p= 0.004) using repeated measures analyses of variance based on mixed models by treating group (controls versus welders) as a between-subjects factor and ROI as a within-subjects factor and adjusting for age, BMI (body mass index), and R2* values. This difference remained significant after correction for multiple comparisons (3 ROIs to be compared) using the Stepdown Bonferroni method (Holm, 1979) to control the familywise error rate (FWER) at p= 0.05 (denoted by *). LOWESS plots depicting the relationship of FA in the GP with c) the exposure measurement of lifetime welding years (YrsW; a second-order polynomial relationship, ß=−0.0002, R2=0.13, p=0.028); d) whole blood Mn level (a second-order polynomial relationship, ß=−0.0008, R2=0.11, p=0.036); and e) the pallidal index (PI; a significant third-order polynomial relationship, ß= 0.0002, R2= 0.30, p=0.009) within welders. [from Lee et al. (2016a)].
