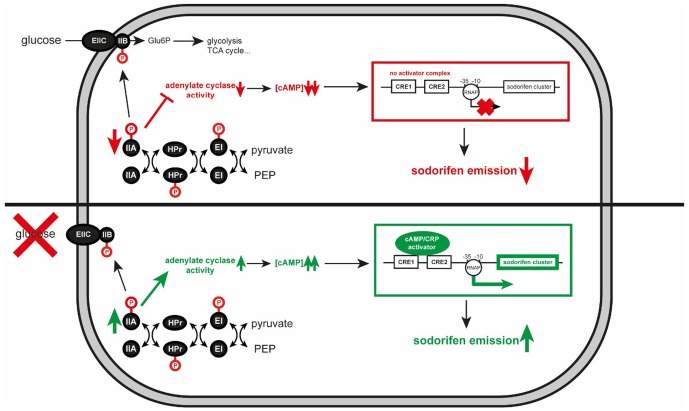
FIGURE 6.
Schematic model of the influence of carbon catabolite repression (CCR) on the sodorifen emission in Serratia plymuthica 4Rx13. Red and green arrows indicate decrease and increase, respectively. Blocked lines represent inhibitory effect. –10 and –35 indicate the promoter of the sodorifen cluster. Glu6P, glucose-6-phosphate; TCA, tricarboxylic acid cycle; P, phosphate group; PEP, phosphoenolpyruvate; RNAP, RNA polymerase; EI, HPr, IIA, components of the phospho transferase system; EIIC and IIB, glucose transporting system; CRE, carbon catabolite responsive element; CRP, cAMP receptor protein.

