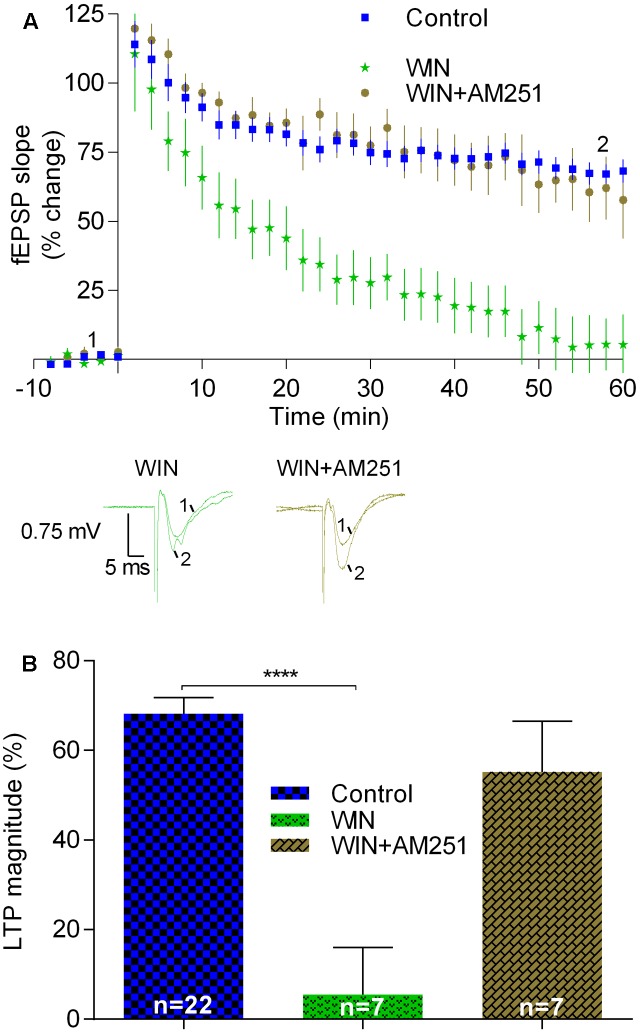
FIGURE 4.
LTP induced by strong-θ-burst is inhibited when CB1Rs are continuously activated. (A) Time course of the averaged fEPSP slopes, and original traces of fEPSP recordings, in control conditions (no drugs) or in the presence of 500 nM WIN (CB1R agonist), or 500 nM WIN together with 1 μM AM251. (B) Quantification of LTP magnitude under the indicated drug conditions. Data in control conditions in panels (A) and (B) are the same as shown in Figures 2A,B, but is represented in this figure to allow comparison with the drug conditions. ∗∗∗∗p < 0.0001 (F(2,33) = 10.3, one-way ANOVA with Sidak’s correction). For further details see legend to Figure 1.

