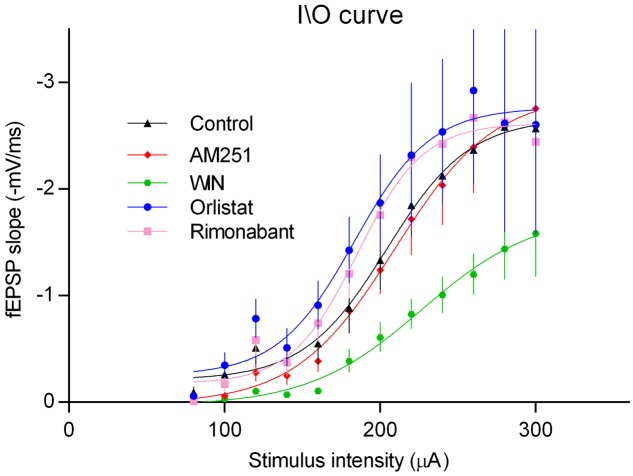
FIGURE 8.
Input/output curves where fEPSP slopes values are plotted against the stimulation intensities (80 and 300 μA) in hippocampal slices under the drug conditions indicated. All values in the figure are represented as the mean ± SEM, n = (5–8). Statistical significance was assessed by two-way ANOVA followed by Sidak’s post hoc test, comparing multiple experimental groups; no significant differences among drug treatments were detected except for the WIN; ∗p < 0.05 as compared with the other drugs) (Finteraction(44,360) = 0.5, Frow factor(11,360) = 38.1, Fcolumn factor(4,360) = 14.4, t-values: control/AM251 – 0.6, control/WIN – 5.2, control/Rimonabant – 1.1, control/Orlistat – 2.1).

