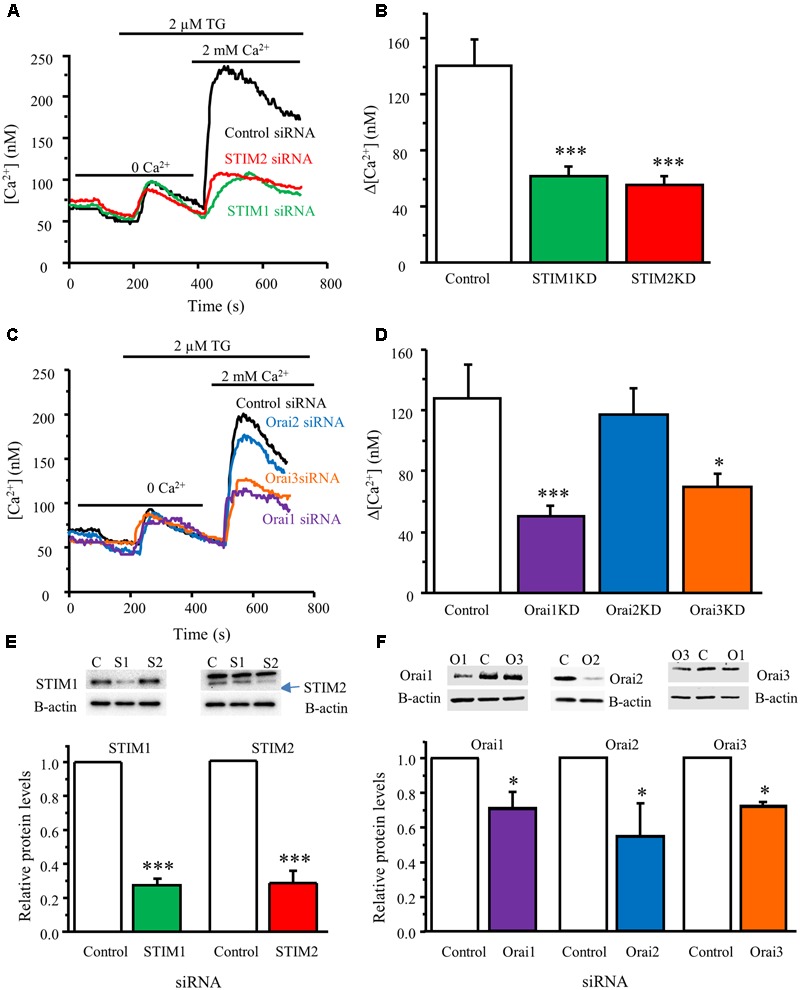
FIGURE 4.

STIM1, STIM2, Orai1, and Orai3 contribute to SOCE in DRG neurons. (A) Representative traces of SOCE in DRG neurons treated with control siRNA, STIM1 siRNA or STIM2 siRNA. (B) Summary result from (A), control group n = 15 neurons, STIM1KD group n = 18, STIM2KD group n = 13. (C) Representative traces of SOCE in neurons treated with control siRNA, Orai1 siRNA, Orai2 siRNA, Orai3 siRNA. (D) Summary of effects of control siRNA (n = 21), Orai1 siRNA (n = 29), Orai2 siRNA (n = 29), Orai3 siRNA (n = 28) on SOCE in DRG neurons. (E) Western blot analysis confirming that STIM1 and STIM2 were significantly knocked down by their specific siRNAs. (F) Western blot analysis confirming that Orai1, Orai2, and Orai3 were significantly knocked down by their specific siRNAs. Values represent mean ± SEM; ∗P < 0.05, ∗∗∗P < 0.001 compared with control by One-way ANOVA in (B,D) and by Student’s t-test in (E,F).
