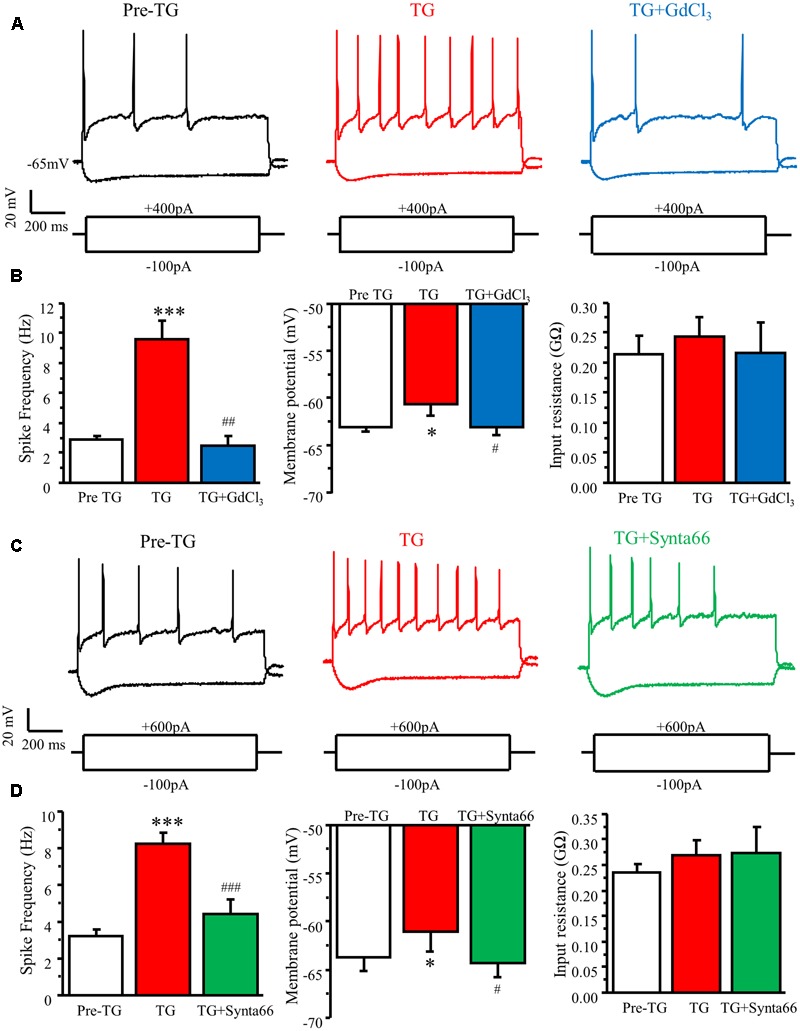
FIGURE 7.

Activation of SOCs by TG increases neuronal excitability in DRG neurons. (A) Representative action potentials recorded in DRG neurons before (Pre TG), 5 min after TG application (TG), and 3 min after GdCl3 addition (TG+GdCl3). (B) Summary of TG-induced changes in spike frequency, membrane potential, and input resistance and attenuation by GdCl3 in DRG neurons. (C) Representative action potentials recorded in DRG neurons before (Pre TG), 5 min after TG application (TG), and 3 min after synta66 addition (TG+synta66). (D) Summary of TG-induced changes in spike frequency, membrane potential, and input resistance and attenuation by synta66 in DRG neurons. Values represent mean ± SEM; n = 6–12 neurons; ∗P < 0.05, ∗∗∗P < 0.001 compared with Pre TG group, #P < 0.05, ##P < 0.01, ###P < 0.001 compared with TG group by Student’s t-test.
