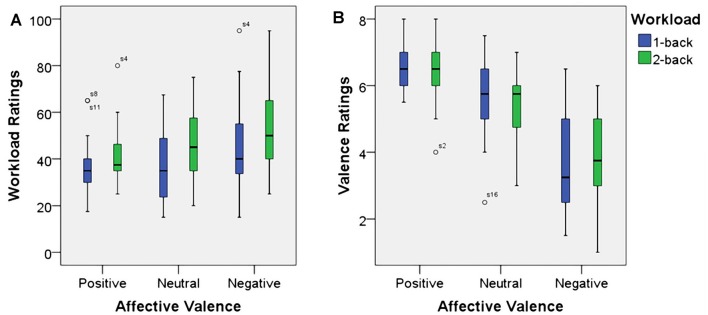
Figure 3.
Box plots showing median values for workload ratings (A) and affective valence ratings (B). Blue boxes show working memory load ratings (A) and affective valence ratings (B) for the 1-back conditions. Green boxes show working memory load ratings (A) and affective valence ratings (B) for the 2-back conditions. Median values are indicated by black horizontal lines within the boxes. Top and bottom borders of the boxes represent the middle 50% of the data. Whiskers represent the smallest and largest values not classified as outliers (between 1.5 and 3 times the height of the boxes) or extreme values (more than three times the height of the boxes). Circles indicate outliers.

