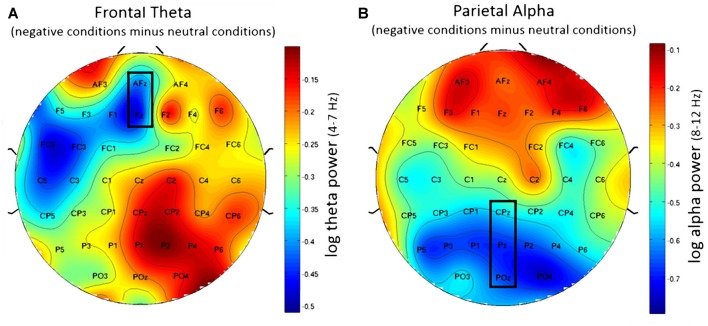
Figure 6.
Topographic plots showing difference in EEG workload measures between negative and neutral conditions. (A) Frontal theta showing decreased frontal theta activity for the negative conditions when compared to the neutral conditions. (B) Parietal alpha showing widespread decrease in parietal alpha power for the negative conditions when compared to the neutral conditions. Nose is at the top. Values are averaged across both N-back levels. Electrodes used for analysis are marked with black rectangles.

