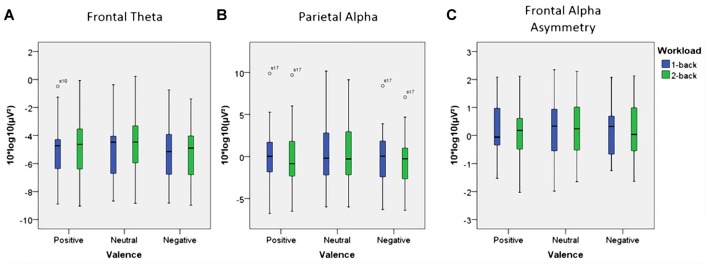
Figure 7.
Box plots showing median values for frontal theta activity, parietal alpha activity and Frontal Alpha Asymmetry (FAA). Blue boxes show frontal theta activity (A), parietal alpha activity (B) and FAA (C) for the 1-back conditions. Green boxes show frontal theta activity (A), parietal alpha activity (B) and FAA (C) for the 2-back conditions. Median values are indicated by black horizontal lines within the boxes. Top and bottom borders of the boxes represent the middle 50% of the data. Whiskers represent the smallest and largest values not classified as outliers (between 1.5 and 3 times the height of the boxes) or extreme values (more than three times the height of the boxes). Circles indicate outliers. Please note the strong variability in the data due to large inter-individual differences.

