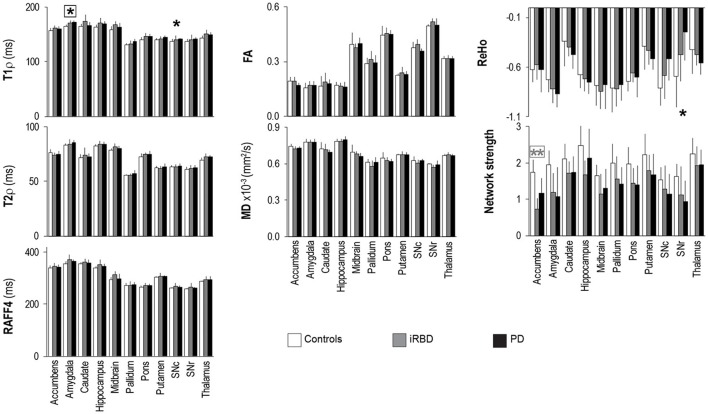
Figure 4.
Group summaries of T1ρ, T2ρ, RAFF4, FA, MD, ReHo and network strength. N = 10, 8, 9 in the control, iRBD and PD groups, respectively, for T1ρ, T2ρ, and RAFF4, whereas N = 9, 8, 9 for FA and MD, and N = 10, 8, 8 for network strength and ReHo. Data shown as mean ± SD. * and ** indicate, respectively, p < 0.05 and p < 0.005 with age-adjustments after Holm's correction (gray: iRBD vs. controls; black: PD vs. controls). Asterisks within a box indicate p < 0.05 after correcting FDR for multiple testing (7 modalities).

