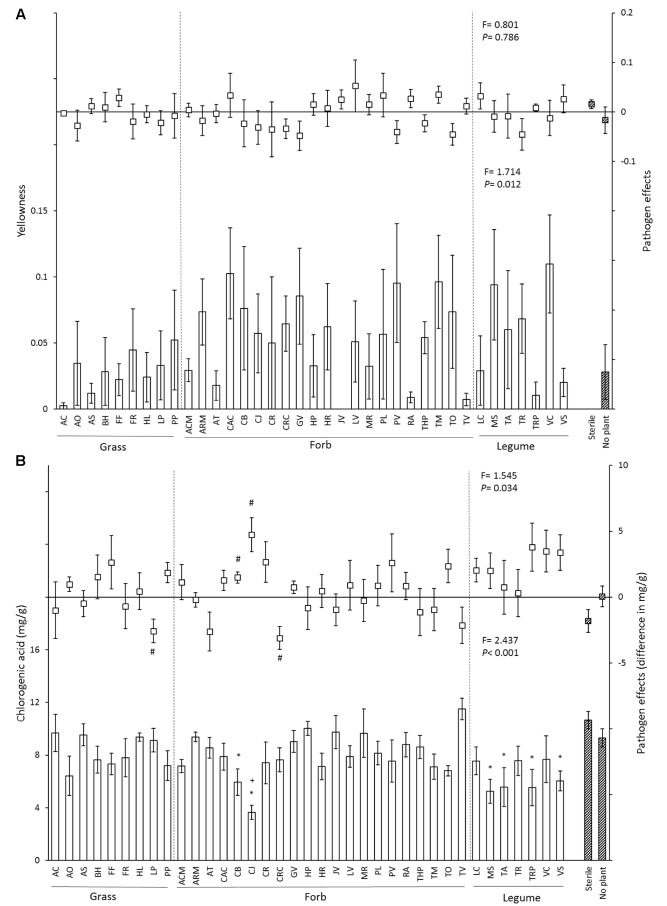
FIGURE 2.
Effects of 37 species-specific soil inocula, no plant inoculum and sterile soil on chrysanthemum yellowness (A) and leaf chlorogenic acid concentration (B). In each figure, bars represent the mean (±SE) of each soil inoculum in control soil, and squares represent the pathogen effect (value in P. ultimum soil – value in non-Pythium inoculated soil). Striped bars indicate controls. “∗” Represents significant difference from the sterile soil (P < 0.05). “+” Represents significant difference from the no plant soil inoculum (P < 0.05), “#” represents significantly different from zero (P < 0.05). Dashed lines separate soil inocula into different functional groups. Statistics presented in the lower part of each panel represent the effects of soil in control soil, and statistics presented in the upper part of each panel indicate the effects of soil inocula on the disease severity of chrysanthemum biomass.

